Thank you both so much! I have managed to save all the maps using the following function:
function MakeTempMaps()
    cd("~Plots/Average Temperature")
    latitude = datamatrix[:, 2]
    longitude = datamatrix[:, 3]
    df1 = [longitude latitude datamatrix[:,4]]
    grd1 = xyz2grd(df1, region=(-180, 180, -60, 75), spacing=(1.0, 1.0))
    C = grd2cpt(grd1, cmap=:polar);
    for i in 1:150
        temp = datamatrix[:,i+3]
        data_points = [longitude latitude temp]
        grid = xyz2grd(data_points, region=(-180, 180, -60, 75), spacing=(1.0, 1.0))

        grdimage(grid, proj=:equidistCylindrical, frame=:af,cmap=C, title = "Temperature Distribution Map ("*string(i+1989)*")", colorbar = true)
        coast!(region=(-180, 180, -60, 75), water="lightblue", proj=:equidistCylindrical, savefig = string(i+1989)*".jpg")
    end
    cd(fig_path)
end
MakeTempMaps()
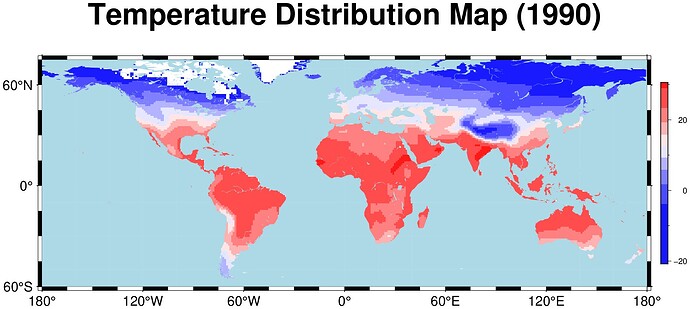
The maps now look like this:
Thank you again for your help. If there is a simple way to use the movie function to create an mp4 out of the images, that would be great, but otherwise I can probably use some other package to string the jpg files together.
One last thing: Is there a cmap argument or color palette (both in color and black/white) with higher contrasts that is easier to read or that you recommend? I am not entirely satisfied with “cmap = polar”.
Thank you for all your suggestions!
Regards
