GMT.jl trouble with grdimage to show my heatmap

Hello everyone,

I am new to GMT and i cannot for the life of me find a solution to my problem. I writing a small code in julia where i read a netcdf dataset spanning over a year. When i extract the longitude and latitude data, i am able with the coast function to generate a map over the desired portion of earth (in this case Europe).
Then i add the grdimage! function in which i give him a grid thanks to the inbuilt GMT.mat2grid function. However, everytime i try, i only get the map of Europe, with no data on it.

Here is my code :

Summary

using NCDatasets
using GMT

println("")
println(“beginning”)
println("")

i=13 #this is to give me data at 12am

data=Dataset(“data_2009.nc”) #import my data

ssr=data[“ssr”]
lat=data[“latitude”]
lon=data[“longitude”]
time=data[“time”]

ssr=ssr.var[:,:].*ssr.attrib[“scale_factor”].+ssr.attrib[“add_offset”] #unfortunately NCDatasets doesn’t do
#any calculation and i need to do it
#myself

ssr=ssr[:,:,i] #get data from time i

lat=lat.var[:] #transform the data of lat into an array

lon=lon.var[:] #same with lon

minssr=minimum(ssr) #find minimum of ssr, not used here but will be later on in my code
maxssr=maximum(ssr) #same with maximum

minlat=minimum(lat) #finding minimum of lat in order to feed into GMT.mat2grid
maxlat=maximum(lat) #same
minlon=minimum(lon) #same
maxlon=maximum(lon) #same

grid=GMT.mat2grid(ssr,x=collect(minlat:0.25:maxlat),y=collect(minlon:0.25:maxlon)) #making the grid

mycmap = makecpt(color=“blue@100,white@50,red”,continuous=true) #no idea if this fella works

coast(region=(minlon,maxlon,minlat,maxlat), #this function works, return a map over Europe
proj=:Mercator,
res=:full,
noframe=:true,
axis=:none,
frame=:false,
land=:gray,
borders=1,
scale=1,
title=time[i])

grdimage!(grid,cmap=mycmap,dpi=200,t=50,show=true) #doesn’t work at all, no heatmap generated over
#coast

And when i run the code, the grid is done correctly as it shows me an array of 277x141 :
x_min: 35.0 x_max :70.0 x_inc :0.25 n_columns :141
y_min: -28.0 y_max :41.0 y_inc :0.25 n_rows :277
z_min: 0.0 z_max :1.7404528786412952e6

However i do get this error everytime,
pscoast [ERROR]: Bad interval in -B option (x-component, a-info): lse gave interval = 0
pscoast [ERROR]: Bad interval in -B option (y-component, a-info): lse gave interval = 0
[:noframe, :axis]

I tried different options with xaxis and yaxis, but i need to admit, i don’t know what i am doing at this point.

Regards
Hi @allaboutmaps well come here. We are also all about maps.

From your procedure I’m guessing that your data is one of those satellite datasets that come with the data array and two more arrays, one for lat and the other for long. This is is still manageable here but needs extra work of gridding the data that is not equally spaced. The GMT.jl has a link to an example of processing such data types. Sorry that it still use the hard-core gMT syntax instead of the long options.

If that is not the case GMT has some other goodies that will avoid some of your code. For example, it can read a layer of a multi-layerd grid, and even apply scale and offset. See longer explanation here for the layer syntax, which would translate in Julia for your case

G = gmtread(“data_2009.nc?ssr[12]”);   # There are good chances that the scale+offset are applied automatically

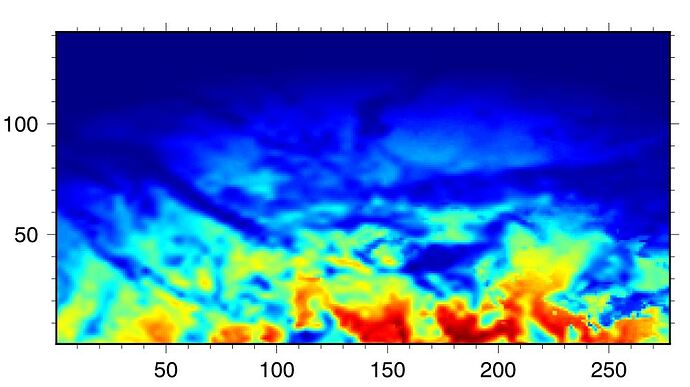
Anyway, you can have a quick view of your data if after the line

ssr=ssr.var[:,:].*ssr.attrib[“scale_factor”].+ssr.attrib[“add_offset”] #unfortunately NCDatasets doesn’t do

you just do

imshow(ssr)

but ofc, this will have no coordinates.

If you can post a link to the data file I’ll try to give it a look but we are busy right now trying to get out GMT6.1

Hello,

Thank you for you reply.

I did manage using the imshow(ssr) to make a heatmap. I also saw that my latitude and longitude were mixed, this was fixed by transposing and reversing the array like this :

Summary

ssr=ssr[:,:,i]
ssr=transpose(ssr)
ssr=reverse(ssr,dims=1)

I am now able to see this :

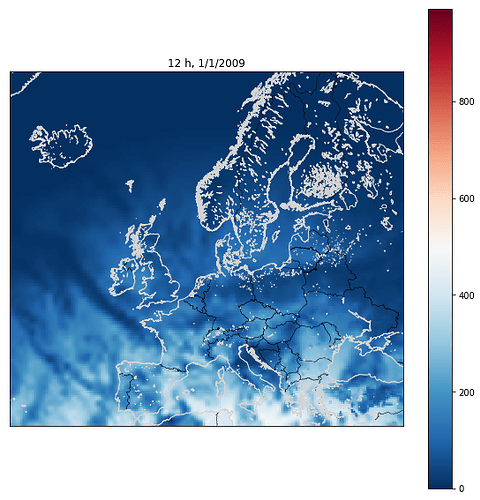
which is pretty much the same thing that python gives me (done with basemap) :

regarding the gmtread option, it is indeed really useful, however (and just for future users), the code must be written as :

G = gmtread(“data_2009.nc?ssr[12]”,grd=true)

otherwise it return an error : “LoadError: Must select one input data type (grid, image, dataset, cmap or ps)”.

Moreover, i would like if possible to keep the “dumb” approach (unless a better option exist), as i would like to perform some calculation on the array later on in my code. For example, ssr=ssr .* some_function. And then plot that new function over a map.

Finally, here is a link were i uploaded a similar file, but containing only the first month of 2009, as the original file is 5GB, (this one is 500MB).

For future users, the file comes from Copernicus it contains mainly hourly data of net solar irradiance, u100, v100 and some others. Here is a link toward the dataset :
https://cds.climate.copernicus.eu/cdsapp#!/dataset/reanalysis-era5-single-levels?tab=overview

Regards

Hmm, the case with the linked file is … trivial. No need to interpolate since all data is already gridded. So, load one layer

julia> G = gmtread("data_1_2009.nc?ssr[12]",grd=true)
title: Surface net solar radiation
command: 2020-04-02 14:08:07 GMT by grib_to_netcdf-2.16.0: /opt/ecmwf/eccodes/bin/grib_to_netcdf -S param -o /cache/data9/adaptor.mars.internal-1585836099.621327-31576-36-31f0e46b-9fad-4aa7-8314-e7670e6a0f43.nc /cache/tmp/31f0e46b-9fad-4aa7-8314-e7670e6a0f43-adaptor.mars.internal-1585836099.6219506-31576-14-tmp.grib
Gridline node registration used
x_min: -28.0    x_max :41.0     x_inc :0.25     n_columns :277
y_min: 35.0     y_max :70.0     y_inc :0.25     n_rows :141
z_min: 0.0      z_max :1.740494e6

and yes, here one needs to specify grd=true because the guessing mechanism that works by looking at the file extension is tricked by the syntax to tell it to load a layer. I’ll look at make it more clever.

Making a map is now as easy as

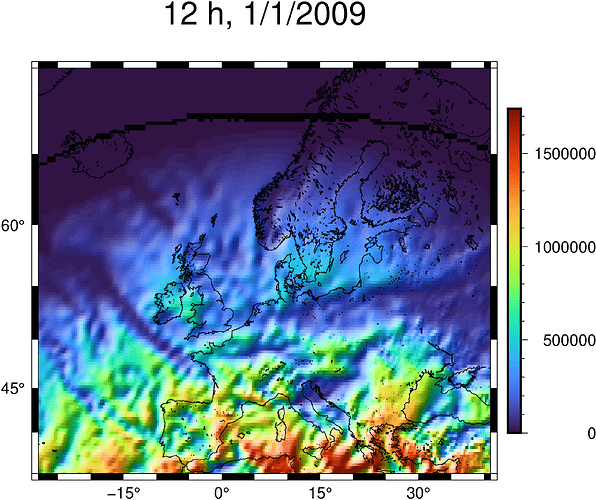
imshow(G, projection=:Mercator, shade=true, coast=true, colorbar=true, title="12 h, 1/1/2009", fmt=:png)

And if you want to do any kind of manipulation you can. Just remember that the G is a struct with the array stored at G.z. But even more easy is when the operation is a basic arithmetic one. For example the scale offset can be done with

G2 = G * 10 + 5
title: Surface net solar radiation
command: 2020-04-02 14:08:07 GMT by grib_to_netcdf-2.16.0: /opt/ecmwf/eccodes/bin/grib_to_netcdf -S param -o /cache/data9/adaptor.mars.internal-1585836099.621327-31576-36-31f0e46b-9fad-4aa7-8314-e7670e6a0f43.nc /cache/tmp/31f0e46b-9fad-4aa7-8314-e7670e6a0f43-adaptor.mars.internal-1585836099.6219506-31576-14-tmp.grib
Gridline node registration used
x_min: -28.0    x_max :41.0     x_inc :0.25     n_columns :277
y_min: 35.0     y_max :70.0     y_inc :0.25     n_rows :141
z_min: 5.0      z_max :1.7404945e7

See the end of gmt_main.jl for how to create functions that operate on the grid objects, For example scaling is just

function Base.:*(G1::GMTgrid, scale::Number)
	G2 = GMTgrid(G1.proj4, G1.wkt, G1.epsg, G1.range, G1.inc, G1.registration, G1.nodata, G1.title, G1.remark,
	             G1.command, G1.datatype, G1.x, G1.y, G1.z .* scale, G1.x_unit, G1.y_unit, G1.z_unit, G1.layout)
	G2.range[5:6] .*= scale
	return G2
end

and now the example image created above.

Hello,

Thank you so much for your answer.

Now i feel like an idiot for not trying out the imshow function. The Occam’s razor is not always the most obvious solution :).

Anyway, thank you so much for your help.

Regards