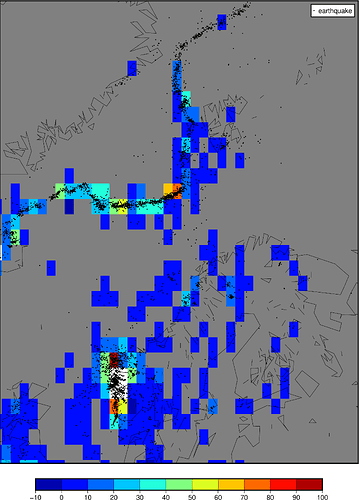
Simple case: count the number of earthquakes in each 1° bin.
- the grid produced is correct (checked in qgis); the number of points in each cell is correct (got confused at first since default is gridline, not pixel node registration)
- when plotting this grid with
grdimage, many of cells containing quakes (black dots) are painted gray, i.e. NaN. Why is this? I tried playing with makecpt (hence the funky colorbar), but to no avail.
- Script and data included.
gmt begin forumpost png

gmt binstats $(gmt info eq-2000-2021.txt -I1) -Gquakes.nc -I1 -Cn -Tr eq-2000-2021.txt -rp
gmt makecpt -T-10/100/10 -Cjet
gmt grdimage quakes.nc -C -B0 -R-5/53/90/81r -JU+34/20c
gmt coast -W -Dc
gmt plot  eq-2000-2021.txt -Sc0.05c -Gblack -l"earthquake"
gmt colorbar

gmt end show
eq-2000-2021.txt (170.7 KB)
Changing -I step solves the problem. (Try -I33k).
If I were to guess, I’d say that -I1(d) near the pole behaves “as if” it was a rectangular 1º cell (~111x111km). But it’s just a guess.
Thanks @PlanetGus, but that still does not explain why the cells with values are painted gray (NaN) by grdimage?
Except if I’m right about the cell size. Once a point is counted in a cell, it is not in other overlapping ones.
In that case, -S would be better than -T (again, this is just my guess)
I don’t get that NaNification effect
julia> G = binstats("eq-2000-2021.txt", R="-24/51/50/88", I="33k", C=:n, T=:r, r=:p);
julia> imshow("quakes.nc", proj=:guess, coast=true, colorbar=true)
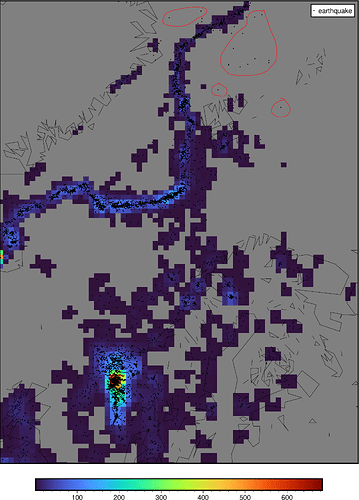
You’re right; changing from -I1 to -I33k improves the matter, but I’m still getting gray cells that should be colored. See att. figure - I’ve highlighted some of the area that have gray cells that should have colored cells.
And why the heck does -I33k improve the matter? I want -I1!
If grdimage does any reproduction to turn your grid into a clipped rectangular image then NaNs will bleed. See -nn to avoid that.
Ah, yes. I have -n+a by default.
Still getting lots of NaNs with -nn, -n+a and -nn+a (where I should not have NaNs).
Thanks Paul for teaching moment; both of these give reasonable results.
I prefer the grdview though, as grdimage -E600 looks smeared.
I know that 1x1 degree cells will be very thin towards the pole, but that’s OK.
So,
- There is not a corresponding
-T option for grdimage? Why not? The only difference, in appearance at least, between the grdimage and grdview command, is that the grdview versions looks like what I expect (and want) grdimage to do.
Not sure, perhaps we decided at one time to not overload grdimage with too many options. But, your near-pole cases do suggest that perhaps the standard results (your first plots) are not a good result for users, and the remedy may require users to just know too much. Pinging our southern guru @Joaquim on what he thinks about
- Add -T as in grdview to grdimage [pretty easy to do: just make a function out of what grdview does and call them from those two programs]. Since grdview was written to do 3-D perspective it may not easily come to mind to use for your 2-D case.
- Detect cases where creating a nx by ny rectangular image either needs a boosting (e.g., a -E under the hood in a way), some warning educates the users, or we decide plotting via -T is the best default?
I don’t have much experience with grdview, so as always; pardon my ignorance.
I use grdimage 99% of the time, but my impression has always been that grdview and grdimage does have a great overlap of use cases - sometimes some rarely used feature forces me to use grdview. In that regard I have thought about grdview as being a superset of grdimage. And, in the mentality of Occam’s razor, you choose the simplest tool for the job.
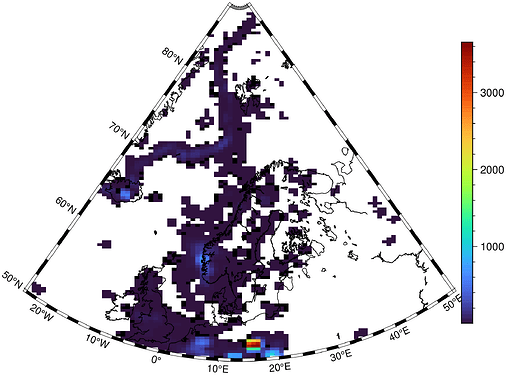
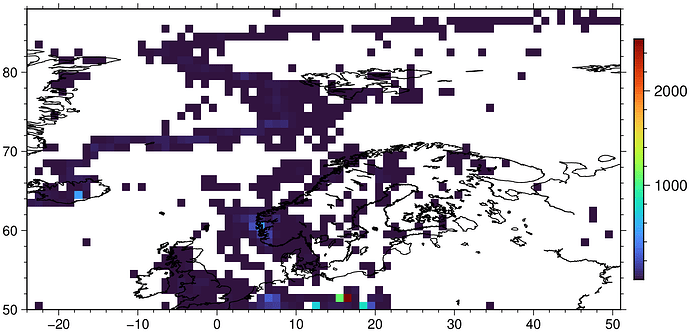
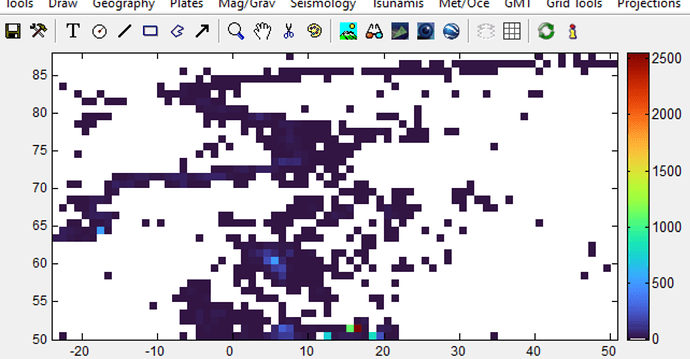
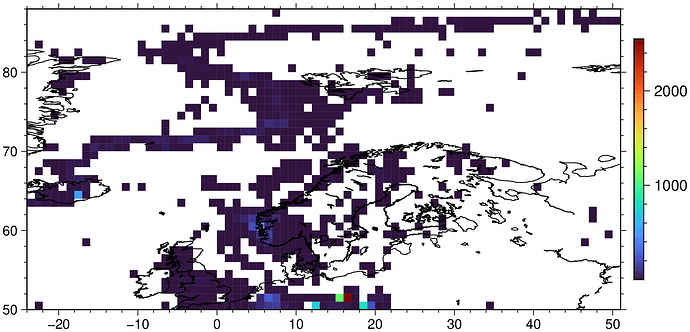
I still fail to see what are those cells that are wrongly painted as NaNs. Bellow is a grdimage of -I1 and the same grid displayed in Mirone. They look the same to me.
And this now is with the new -T in grdimage. Almost equal to before, except that we now see faint outline of cells.
julia> imshow("quakes.nc", T=true, coast=true, colorbar=true, Vd=1)
        ["grdimage quakes.nc  -JX14c/0 -R-24/51/50/88 -Baf -BWSen -n+a -T -C -P -K > C:\\TEMP\\GMTjl_tmp.ps", "pscoast  -J -Rquakes.nc -A200/0/2 -W0.5 -Da -K -O >> C:\\TEMP\\GMTjl_tmp.ps", "psscale  -J -Rquakes.nc -Baf -DJMR -C -K -O >> C:\\TEMP\\GMTjl_tmp.ps"]
Well, just a linear projection. Then of course it look’s right. Try Andreas’s projection and then the problem shows
Ah, in my projected version, I was not plotting the points (and not even paying attention to them) to compare with colors.
