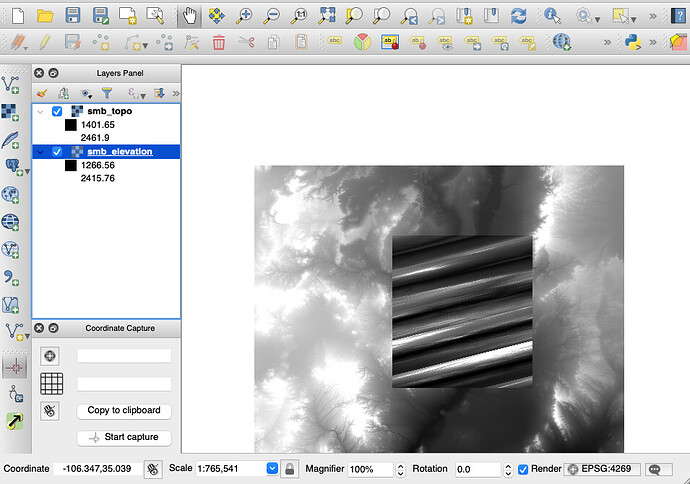
I am having an issue that has recently occurred with newer versions of GMT. I had a netCDF raster image of central NM that I was cutting with grdcut in using the following lines
>> LATMIN=33.8000462963
>> LATMAX=34.6204166667
>> LONMIN=-107.251898148
>> LONMAX=-106.497453704
>> gmt grdcut smb_elevation.nc -R$LONMIN/$LONMAX/$LATMIN/$LATMAX -Gsmb_topo.nc -V
As I mentioned, this was line of code was working just fine prior to upgrading GMT. I’ll also note that I have had to upgrade my macbook to Big Sur recently so a lot of upgrades have occurred recently. This line specifically seems to later my output *.nc file so that it looks completely warped. Here is the verbose output from executing that line.
grdcut [INFORMATION]: Processing input grid
grdcut [INFORMATION]: File smb_elevation.nc reads with GDAL driver HFA
grdcut [INFORMATION]: Cartesian input grid
grdcut [INFORMATION]: Round-off patrol changed grid limit for xmin from -108.0005092597349 to -108.0005092597349
grdcut [INFORMATION]: Round-off patrol changed grid limit for xmax from -105.9994907412076 to -105.9994907412076
grdcut [INFORMATION]: Round-off patrol changed grid limit for ymin from 32.99949074088585 to 32.99949074088585
grdcut [INFORMATION]: Round-off patrol changed grid limit for ymax from 35.00050925941316 to 35.00050925941316
grdcut [INFORMATION]: Reading grid from file smb_elevation.nc
grdcut [INFORMATION]: Read band(s): 1
grdcut [INFORMATION]: Set boundary condition for all edges: natural
grdcut [INFORMATION]: Set boundary condition for left edge: natural
grdcut [INFORMATION]: Set boundary condition for right edge: natural
grdcut [INFORMATION]: Set boundary condition for bottom edge: natural
grdcut [INFORMATION]: Set boundary condition for top edge: natural
grdcut [INFORMATION]: File spec: W E S N dx dy n_columns n_rows:
grdcut [INFORMATION]: Old:grdcut [INFORMATION]: -108.00050926 -105.999490741 32.9994907409 35.0005092594 9.2592592538e-05 9.25925925959e-05 21612 21612
grdcut [INFORMATION]: New:grdcut [INFORMATION]: -107.251898148 -106.497453704 33.8000462963 34.6204166667 9.2592592538e-05 9.25925925959e-05 8149 8861
grdcut [INFORMATION]: Writing grid to file smb_topo.nc
grdcut [INFORMATION]: Proj4 string to be converted to WKT:
+proj=longlat +datum=NAD83 +no_defs
grdcut [INFORMATION]: WKT converted from proj4 string:
GEOGCS[“unknown”,
DATUM[“North_American_Datum_1983”,
SPHEROID[“GRS 1980”,6378137,298.257222101,
AUTHORITY[“EPSG”,“7019”]],
AUTHORITY[“EPSG”,“6269”]],
PRIMEM[“Greenwich”,0,
AUTHORITY[“EPSG”,“8901”]],
UNIT[“degree”,0.0174532925199433,
AUTHORITY[“EPSG”,“9122”]],
AXIS[“Longitude”,EAST],
AXIS[“Latitude”,NORTH]]
I can follow most of the output till the line about Proj4 string to be converted to WKT. I’ll also give the output from grdinfo.
smb_elevation.nc: Title: Grid imported via GDAL
smb_elevation.nc: Command:
smb_elevation.nc: Remark:
smb_elevation.nc: Gridline node registration used [Geographic grid]
smb_elevation.nc: Grid file format: gd = Import/export through GDAL
smb_elevation.nc: x_min: -108.00050926 x_max: -105.999490741 x_inc: 9.2592592593e-05 name: x n_columns: 21612
smb_elevation.nc: y_min: 32.9994907409 y_max: 35.0005092594 y_inc: 9.2592592593e-05 name: y n_rows: 21612
smb_elevation.nc: z_min: 1259.08984375 z_max: 2504.15893555 name: z
smb_elevation.nc: scale_factor: 1 add_offset: 0
+proj=longlat +datum=NAD83 +no_defs
Attached is an image from QGIS where I could look at both rasters and you can see how the output raster gets warped after the grdcut conversion. the original “smb_elevation.nc” was created in QGIS from image rasters downloaded from the USGS national map as IMG formatted files. For easy use in GMT, I did the conversion here. I’m not sure if projection/header information is incorrect, but this function (grdcut) was working on this file before I had to upgrade my GMT package. Any help or advice on how to work this would be appreciated.
