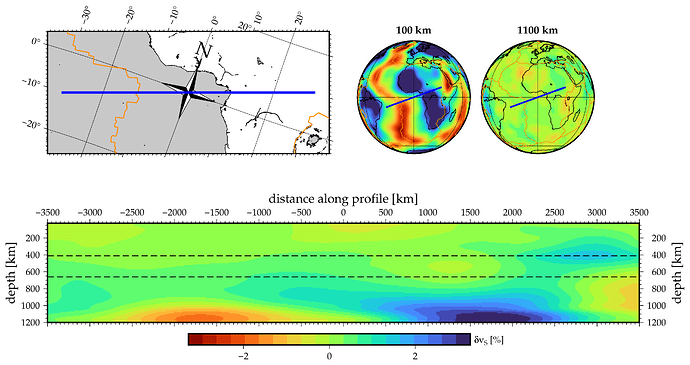
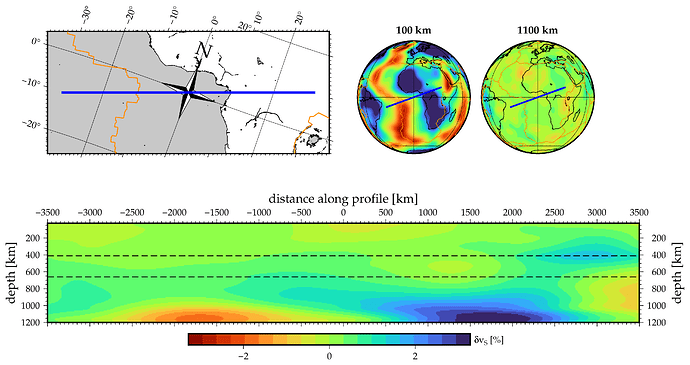
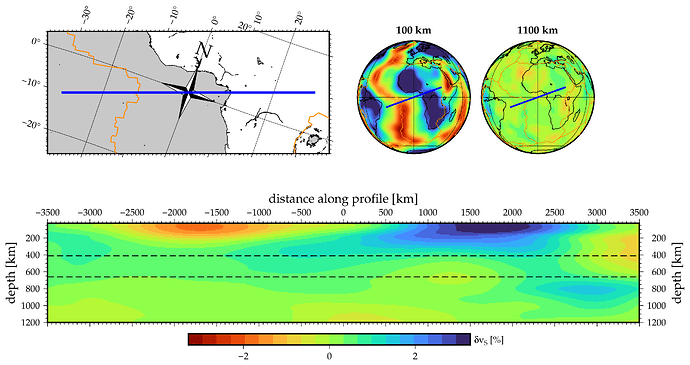
I wonder about how the extracted grid from grdinterpolate is meant to be sorted with the -E and -T options. The script below (sorry, not sure how to make this easier) makes the attached plot. If I extract map views from the GMT Cube with -T, the depths (100 and 1100 km in this example) work fine, but when I extract -T50/1200/50 along a profile, the content of the grid file looks depth reversed (I’ve plotted it top down, but the large amplitudes shown around 1200 should be at the top, small depths).
Thanks!
Thorsten
#!/bin/bash
# plot profile through tomography model in GMT Cube format
dv=${1-dv}		# GMT cube, without the .nc
                        # e.g. as created from make_cube_from_tomo_grids
lon=${2-0}		# center of profile
lat=${3-0}
azi=${4-70}			# azimuth of profile
hl=${5-3500}			# profile half length km


oview=1				# 1: overview map
addslices=1			# map view slice

lspc=2;label="@~d@~v@-S@- [%]"	# for colorbar

xinc=10				# spacing of profile
zinc=$xinc				# depth spacing
zbot=1200				# maximum depth of profile

keep=1				# keep the profile grid
tmpn=`mktemp`
trap "rm -f $tmpn*" EXIT
if [ ! -s $dv.nc ];then
    echo $0: GMT cube file $dv.nc not found
    exit
fi
grdinfo -C -Q $dv.nc | gawk '{print($6,$7)}' > $tmpn.dat # check bounds of cube
read zmin zmax < $tmpn.dat
echo $0: working on $dv.nc zmin $zmin zmax $zmax prof: $lon $lat azi $azi hl $hl
if [ $zmax -lt $zbot ];then
    echo $0: error zbot $zbot
    exit
fi
project -C$lon/$lat -Q -L-$hl/$hl -G$xinc -A$azi > $tmpn.prof # make profile
if [ $keep -eq 1 ];then
    ogrid=$dv.p.$lon.$lat.$azi.$hl.grd
else
    ogrid=$tmpn.grd
fi
if [[ ! -s $ogrid ]];then	# extract a profile
    grdinterpolate $dv.nc -G$ogrid -E$tmpn.prof -T$zmin/$zbot/$zinc
else
    echo $0: reusing $ogrid
fi
#grdinfo $ogrid

ofile=$dv.p.$lon.$lat.$azi.$hl.ps
grd2cpt $ogrid -Cturbo -D -T= -E21 -I > $tmpn.cpt
# set the region to what should be the grid dimensions
reg=-R-$hl/$hl/$zmin/$zbot
scale=0.0015
proj="-Jx"$scale"/-"$scale
# slice plot
grdimage $ogrid -C$tmpn.cpt  $reg $proj \
	 -Ba500f50:"distance along profile [km]":/a200f50:"depth [km]":WEsN -K -P > $ofile
for zl in 410 660 ;do
    cat <<EOF | psxy $reg $proj -O -K -W1,- >> $ofile
-$hl $zl
$hl $zl
EOF
done
psscale -Dx5/-.2/5/.2h -C$tmpn.cpt -B$lspc/:"$label": -O -K >> $ofile
if [ $oview -ne 0 ];then
    #preg=`minmax $tmpn.prof -I1`
    preg=-R-35/35/-15/15
    gproj=-JOA$lon/$lat/$azi/5
    pscoast -Di $preg $gproj -W0.5 -S200 -K -O -Y3  >> $ofile
    psbasemap $preg $gproj "-Tdg"$lon/$lat"+w1i+f+l,,,N" -O -K \
	      -Ba10g20f1WesN >> $ofile
    psxy $datadir/plate_boundaries/bird_PB2002/PB2002_tdiddy.gmt  -m  \
	 $preg  $gproj -fg -O -K   -W1,darkorange  >> $ofile

    psxy $preg $gproj -O -K -W3,blue $tmpn.prof >> $ofile
fi
if [ $addslices -ne 0 ];then
    i=1
    for z in 100 1100;do
	grdinterpolate $dv.nc -G$tmpn.$i.grd -T$z & # extract layer
	zs[$i]=$z
	((i=i+1))
    done
    ((n=i-1))
    wait
    preg=-Rg
    gproj=-JG$lon/$lat/2
    for i in `seq $n`;do
	if [ $i -eq 1 ];then
	    off="-X5.5"
	else
	    off=-X2.2
	fi
	grdimage $preg $gproj $off $tmpn.$i.grd -Bg60 \
		 -C$tmpn.cpt -O -K >> $ofile
	pscoast -Dl -A9000 $preg $gproj -W0.5  -K -O  >> $ofile
	psxy $datadir/plate_boundaries/bird_PB2002/PB2002_tdiddy.gmt  -m  \
	     $preg  $gproj -fg -O -K   -W0.5,darkorange  >> $ofile
	psxy $preg $gproj -O -K -W2,blue $tmpn.prof >> $ofile
	echo 0.5 1.1 14 0 31 MC "${zs[$i]} km" | \
	    pstext -R0/1/0/1 -JX2 -O -K -N >> $ofile
    done

fi
echo 1000 -1000 0.1 | psxy $reg $proj -Sa -O >> $ofile
psconvert $ofile -A+m0.1 -Tf 			# convert to PDF
rm $ofile
Probably a “feature”. Could you send the grdinfo output from the slice that is upside down?
grdinfo dv.p.0.0.70.3500.grd
dv.p.0.0.70.3500.grd: Title: z
dv.p.0.0.70.3500.grd: Command: grdinterpolate dv.nc -Gdv.p.0.0.70.3500.grd -E/tmp/tmp.OqAKwKRXC8.prof -T25/1200/10
dv.p.0.0.70.3500.grd: Remark: Grid slide through 3-D data cube
dv.p.0.0.70.3500.grd: Gridline node registration used [Cartesian grid]
dv.p.0.0.70.3500.grd: Grid file format: nf = GMT netCDF format (32-bit float), CF-1.7
dv.p.0.0.70.3500.grd: x_min: -3500 x_max: 3500 x_inc: 10 name: Distance ( n_columns: 701
dv.p.0.0.70.3500.grd: y_min: 25 y_max: 1195 y_inc: 10 name: y n_rows: 118
dv.p.0.0.70.3500.grd: v_min: -1.76781523228 v_max: 3.27705168724 name: z
dv.p.0.0.70.3500.grd: scale_factor: 1 add_offset: 0
dv.p.0.0.70.3500.grd: format: netCDF-4 chunk_size: 141,118 shuffle: on deflation_level: 3
I will need to debug it seems. We are using the depth values to extract the horizontal slices so I dont see how we could get it to be radial values instead. How can I get my hand on your dv.nc grid?
It’s moderately big (160M) but should be OK? Let me know if you want me to downsample
https://www.dropbox.com/s/asu7zwyqmz3fyn3/dv.nc?dl=0
Thanks!
Sure, got it. But now I wonder how you created it. From the ncdump it seems to have been made like this:
gmt grdinterpolate dv.*.grd -Gdv.nc
but the history does not show the actual command, just the list of grids. COuld you tell me now you made the cube?
The grids are read in with a file that specifies depths bottom-up, from large to small numbers, like 2800, 2700, 2600, … 100, 50. Could that be the problem?
I would have thought it should be okay (ascending vs. descending list of layer depths in the -T file) since the layer extraction for certain depths works as expected (I checked, and they are numerically indetical)?
Perhaps, I need to have a look in the debugger. Might you be able to share the exact grdinterpolate command and if you gave a file in -T then that file too. I dont need the grids - I can fake thouse.
I just redid it like that with the rdepths.dat file attached.
rdepths.dat (268 Bytes)
That one is now sorted top down with increasing numbers, but when I run the plotting script, I get the same issue as before, individually extracted slices are correct, but the profile extraction is reversed. I feel like it must be something simple, maybe I am just confusing myself.
Thanks!
Sorry, the assembly line was unreadable, here again as text file
tmp.txt (612 Bytes)
Thanks, I will have a look after a handful of less-interesting zoom meetings…
So it comes down to the order of the grids on the command line. I can reproduce your situation with a few small grids if I list them in the wrong order and give a -Z that is in the right order. The cube is then switched but the -Z array is not. I cannot tell if your dv.58.grd is corresponding to z = 25 but if it is not then that is the source of the problem. If dv58 is the deepest layer and dv.1.grd is the shallowest then your file order needs to change. If they actually are in the right order zmin to zmax then I am not sure how to reproduce it.
dv.58 is actually the shallowest grid corresponding to the smallest depth, 25, so the grids should be sorted okay. Even if they were mixed, I don’t get how extracting a single layer at arbitrary depth would work but extracting a profile wouldn’t ?
Thanks for confirming. I will try to debug this case and see.
OK, I have reproduced the problem with 3 layers of synthetic tiny grids. Now I need to debug to see why.
Thanks for this example, now fixed in master and will be part of rc2.
Confirmed, thank you!
(Had to do a make clean; make after the git pull, simply make didn’t seem to catch it?!)
Great! Well, who knows how make/cmake etc works. On macos I sometimes have to reboot to force gmt to load the latest shared libgmt…


