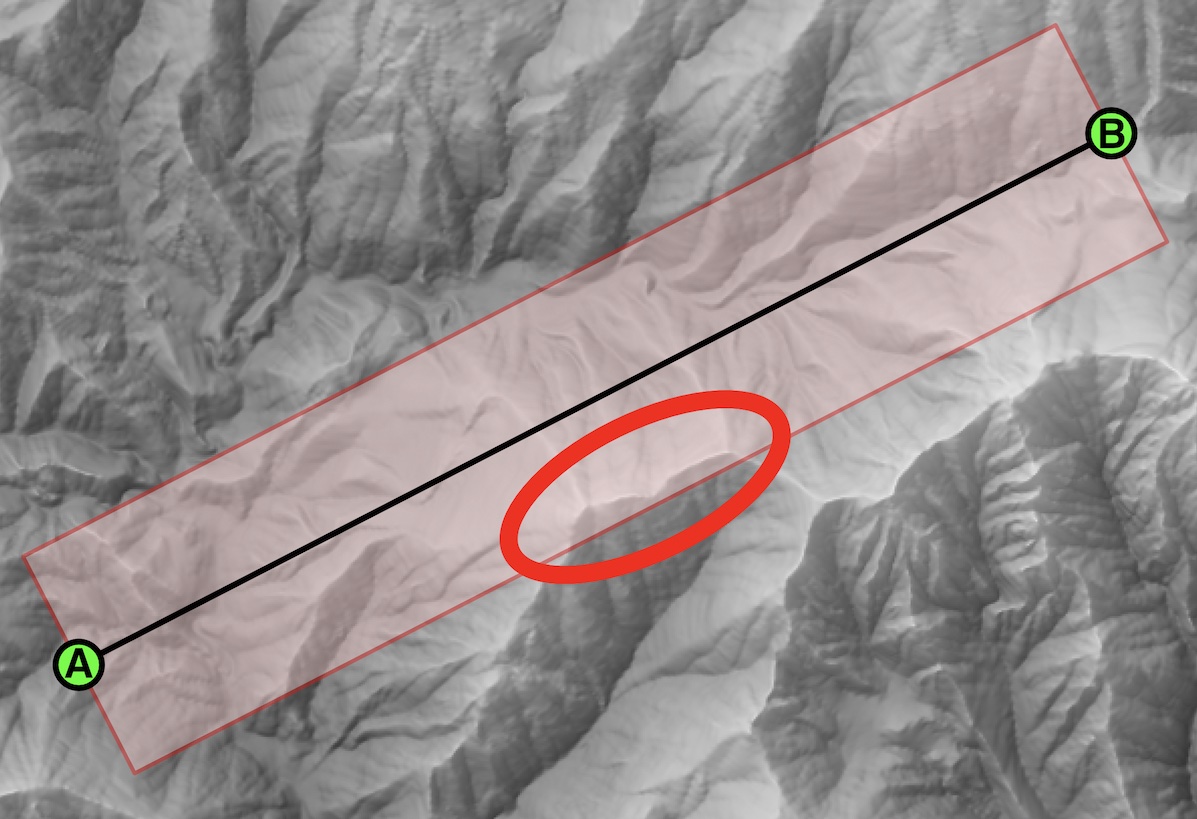
I have a track between points A and B (black line) surrounded by a corridor 5 NM right & left of said track (reddish box).
What I need to extract is a vertical profile of the highest terrain in the corridor between A and B (crude representation in lower graphic) with an 100m increment.
My mental picture is to compress the reddish area onto the black line keeping the highest values. For example the red circled peaks which are higher than the terrain under the black track will be the values reported for the mid-section of the track.
While it was not designed for this specific case, see if grdtrack -F with -C selecting a dense set of cross profile of width 5 nm will return the max value per crossection and that would be your max hight profile.
Down the road, allowing -S instead of -F and pass a flag that says collapse the found values onto the profile might be a useful option and would do what you want as well.
Now I’m not sure I understand what you want. Is it a profile parallel to AB but that passes through the highest point (my, non-obvious-to-implement recipe). Or a profile along AB but made off the highest point across the AB line and inside the red region?
Good morning @pwessel, I’ll read into grdtrack (haven’t used it yet) and give it a try. I assume a spacing smaller than the DEM resolution will be necessary?
I tried to reply but eventually removed the post because I don’t have the scripts anymore, but a long time ago, in a far far galaxy, I did something like this (which is I guess what you want) :
one to create multiple tracks within the rectangle
the plottings
Sorry to not help more, but if it can better illustrate your point
(and I now realize that the transparency is hideous, you’re supposed to see light grey tracks)
Hi @Joaquim your second option is what I’m after. My apologies for my not explaining it clearly enough.
My use case is a departure corridor from an airport. As aircraft and mountains don’t mix very well there is an assessment wether a certain routing is safe to fly. You assume an aircraft has to maintain a certain climb gradient from the runway end. Lets say 3.9%. As you need some allowance in horizontal navigation accuracy it is assumed that the 3.9% gradient is the lower limit of a 10 NM wide corridor. I’m trying to figure out how close the terrain actually gets to that corridor.
First column contains the x-coordinates
All others are Ys shifted from -1std to +1std around a mean state defined by yfit
(Thus, the file is 101 columns wide)
I generated tracks with a loop :
    for col in {1..100};
    do
    gmt grdtrack tracks.txt -i0,${col} -Ggridded_file.nc  > profile_${col}.txt -Vq
    done
This give me 100 individual tracks (1 per text-file), represented by the rectangles (upper panel) … which I later average to give the plot in the bottom panel (in your case this panel would show only the UPPER of each track) :
For clarification: An extension from the first segment up to the bisecting angle and the second segment back to the bisection angle would cover the red segment for the price of a larger overlap. This would be a more conservative approach but acceptable.
Good morning @pwessel the enhanced grdtrack -F option surely would be the deluxe solution. I tried to get to my goal without incurring even more workload on you and your fellow devs. I feel a bit bad for all my feature requests.
Hi! I feel that this kind of plot is called swath profile. I have posted my idea in Swath profiles using grdtrack. The method is indirect and a little complex. You can check it again. I will be very happy if it is still helpful for you now. Please fell free to contact with me if you have any idea.