Hi there,
The question is pretty much in the title. I have a NetCDF file containing wind vectors :
float u(time, latitude, longitude) ;
float v(time, latitude, longitude) ;
But instead of plotting the arrows in lon-lat diagram, I’d like to plot them in lon-time.
The first step seems to be to average v for each time increment using grdfilter (-Fm[...] within my box of interest), then to plot it.
The question is how ? How do I achieve these two steps ?
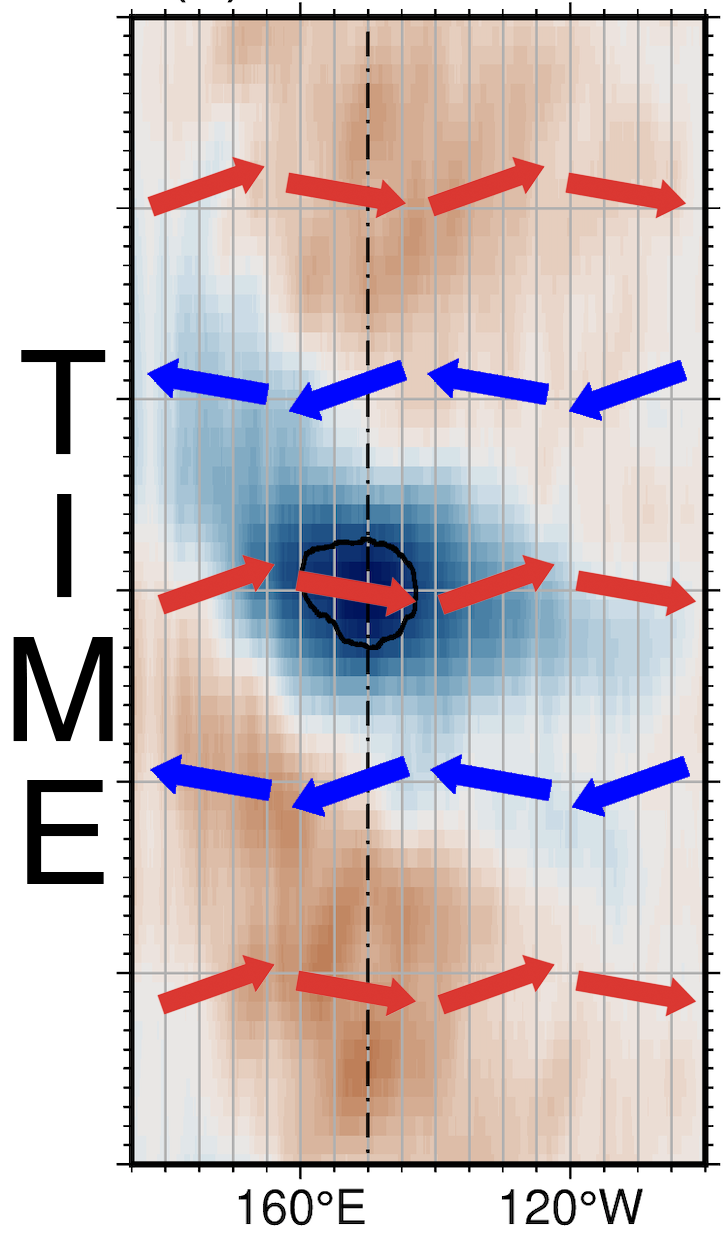
Something like this :