Hi, I would like to produce a plot which is a 3D perspective with contours, possibly annotated.
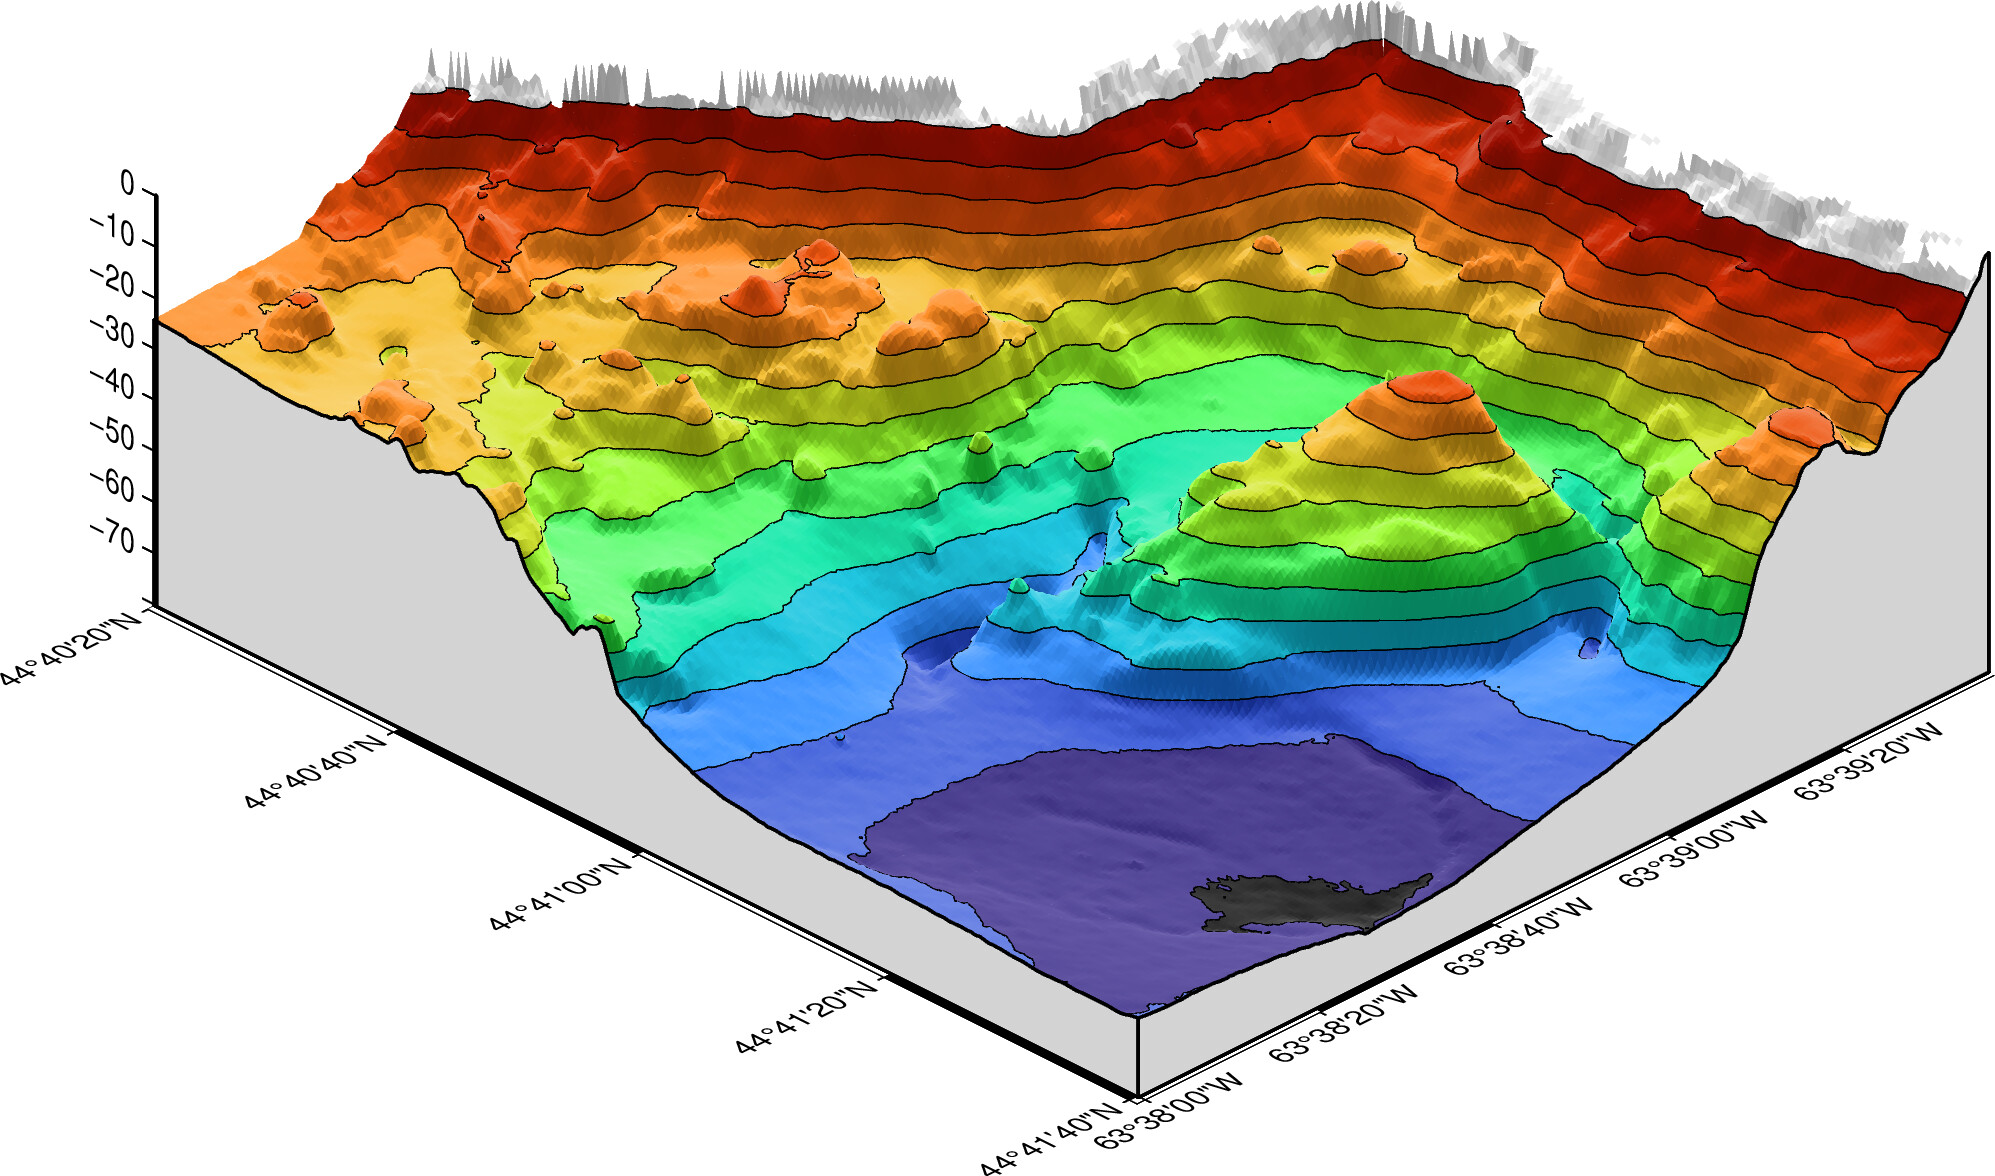
I want to get a 3D perspective plot like this

This required 1) a call to grdimage -I to produce a color map w/shading and 2) a call to grdcontour -C -A... to produce contours incl annotations - on top of the color map.
Maximum what I’ve been able to get with grdview so far is the two variants below. One with shaded relief, smooth color palette making contours not possible and the other with contours but not smooth color palette:

The grdview scripts:
gmt begin ex51-2-1 png -C
gmt makecpt -Cturbo -T-72/-3 -H > "BB_bathymetry.cpt"
gmt grdview "$BB_Bathymetry" -I+a-135+nt0.75+m0 -p45/30/-80 -Qi50c \
     -C"BB_bathymetry.cpt" \
     -Jz0.05c -B20s -Bz10 -BNEZ -JM4i \
     -R-63:39:37/-63:38/44:40:20/44:41:40/-80/0 \
     -N-80+glightgray
gmt end
gmt begin ex51-2-2 png -C
gmt makecpt -Cturbo -T-70/-5/5 -H > "BB_bathymetry_contour.cpt"
gmt grdview "$BB_Bathymetry" -I+a-135+nt0.75+m0 -p45/30/-80 -Wc0.25p,black,solid \
  -C"BB_bathymetry_contour.cpt" -Qs -Jz0.05c -B20s -Bz10 -BNEZ \
  -JM4i -R-63:39:37/-63:38/44:40:20/44:41:40/-80/0 -N-80+glightgray
gmt end
I want a smooth color scale on 3D perspective plot with shades plus contours (annotated if possible) but couldn’t find out how to plot it the way I want. I can plot with a smooth color palette but then plotting contours only with a second call and a special categorical .cpt file for the contours seems not possible? If I use the .cpt that is good for contours, every 5 meters, smooth color plot seems not possible?
Suggestions are much appreciated.