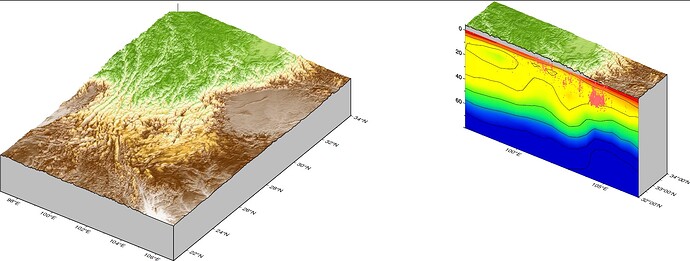
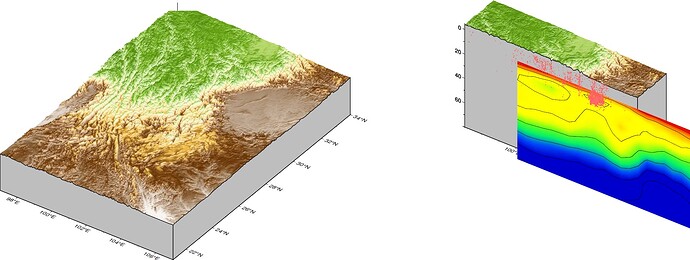
Hi all,
I was following this example on github;
I can obtain same result if use gmt 6.4 and pygmt 0.13.0 but if i switch to latest version (currently 6.5) result becomes different.
Code from the above link:
Code
import pandas as pd
import pygmt
import numpy as np
import  xarray as xr


# read model and convert to xarray
# the model:https://github.com/ShouchengHan/USTClitho2.0/blob/main/USTClitho2.0.wrst.sea_level.txt
velocity = pd.read_csv('USTClitho2.0.wrst.sea_level.txt',sep='\s+',names=['longitude','latitude','depth','vp','vs'])
velocity = velocity.set_index(['latitude','longitude','depth'])
USTClitho2 = xr.Dataset.from_dataframe(velocity)
#USTClitho2.vp.sel(depth=20).plot(cmap='jet_r')

names = ['year','month','day','hour','minute','second','latitude','longitude','depth','magnitude']
catalog = pd.read_csv('http://cses.ac.cn/wp-content/uploads/2020/01/cata2019.txt',sep='\s+',names=names)


# cut the model to region
region = [97,107,21,34,0,80]
lon1,lon2,lat1,lat2,dep1,dep2 = region
model = USTClitho2.where((USTClitho2.longitude >= lon1) & (USTClitho2.longitude <= lon2) & (USTClitho2.latitude >= lat1) & (USTClitho2.latitude <= lat2),drop=True)

# interpretation the model to 0.02*0.02*1
lons = np.arange(lon1,lon2+0.01,0.02)
lats = np.arange(lat1,lat2+0.01,0.02)
deps = np.arange(dep1,dep2+0.01,1)
model = model.interp(longitude=lons,latitude=lats,depth=deps)


# get the topography
topo = pygmt.datasets.load_earth_relief(resolution='01m',region=region)
topo = -1*topo/1000 # convert m to km
clon,clat = 102,28
index = (topo.lon >= clon ) & (topo.lon <= lon2) & (topo.lat <= clat) & (topo.lat >= lat1)
ele = topo.where(~index)
ele.data = ele.data


azimuth = 145
elevation = 35
pz='{}/{}'.format(azimuth,elevation)

fig = pygmt.Figure()
pygmt.config(MAP_FRAME_TYPE='plain',FONT='9p',MAP_FRAME_PEN='0.5p')
fig.basemap(region=[97,107,21,34,0,20],projection='M10c',zsize='-2c',frame=['xa2f1','ya2f1','wSEnZ'],perspective='z'+pz)
pygmt.grd2cpt(grid=topo,cmap='dem1',output='dem.cpt',continuous=True)
fig.grdview(grid=topo,cmap='dem.cpt',shading=True,surftype='i',plane='20+ggray',perspective=True)

# 提取对应纬度的剖面
plane = '80+ggray'
frame = ['xaf','yaf','zaf','wSEnZ']
pygmt.makecpt(cmap='seis',series=[4.5,7.5,0.1],continuous=True,background=True,output='depth.cpt')
PA = [97,107,32,34,-5,80]
lon1,lon2,lat1,lat2,dep1,dep2 = PA
gridA = topo.where(topo.lat >= lat1,drop=True)
fig.shift_origin(xshift='22c',yshift='3c')
fig.basemap(region=PA,projection='M10c',zsize='-6c',frame=frame,perspective='z'+pz)
fig.grdview(grid=gridA,surftype='i',plane=plane,shading=True,cmap='dem.cpt',perspective=True)

# 绘制速度剖面
xz = model.vp.sel(latitude=lat1,method='nearest')
rxz = [lon1,lon2,dep1,dep2,lat1,lat2]
fig.grdimage(grid=xz.transpose(),cmap='depth.cpt',region=rxz,projection=['X{}c/-{}c'.format(10,6),'Z{}c'.format(10)],perspective='y'+pz+'/{}'.format(lat1))
fig.grdcontour(grid=xz.transpose(),perspective=True,interval=0.5)

# 叠加地震剖面
data = catalog[['longitude','latitude','depth','magnitude']]
track = pygmt.project(data=data,center=[lon1,lat1],endpoint=[lon2,lat1],width=[-20,20],unit=True)
track = track.rename(columns={0:'longitude',1:'latitude',2:'depth',3:'magnitude',4:'p',5:'q',6:'r',7:'s'})
fig.plot3d(region=PA,projection='M10c',zsize='-6c',x=track.r,y=track.s,z=track.depth,style='uc',size=0.01*track.magnitude,fill='red',perspective='z'+pz)
fig.show()
I read the changelog but couldn’t find anything. Any help is appreciated.

