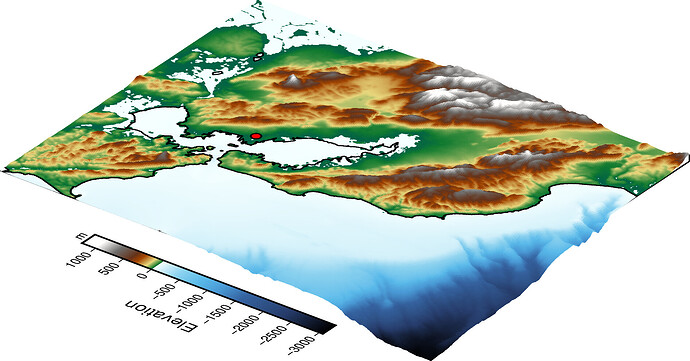
Grdview topography with coastlines

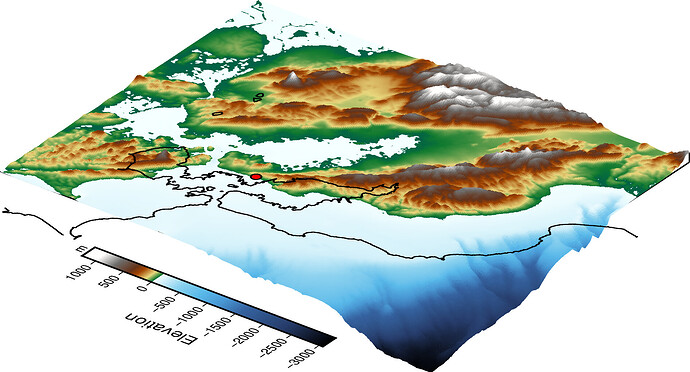
I tried to extend the grdview example provided for plotting 3D perspective of topography. I’d like to add coastlines and data points on the map, but they appear to be offset.

I started with the case
https://www.pygmt.org/v0.3.1/tutorials/3d_perspective_image.html#sphx-glr-tutorials-3d-perspective-image-py

The attached image with coastlines and point offset (point should be on downtown Oakland northeast of where it appears). I must have to specify something with the z-component projection or region. Any ideas?

Also, is there a way to upload my jupyter notebook for this case?
1 Like

In order to plot lines in 3D, you must indicate z value. So you have to indicate it or added to your data set.

The more general way would be to use grdtrack to create a new file with a column with z value.

Thanks @Esteban82 . Here is my code, but I’m not exactly sure how to fix the problems.

For plotting points, do I use fig.plot3d() instead of fig.plot() ?I tried plot3d() with z=0 and get the same problem.

For coastlines, is there a way to make fig.coast() plot coastlines at z=0 (sea level)?

import pygmt
reg = [-123, -121.5, 36.75, 38.25]

# Resolution 15m, 03m
res = "15s"
#res = "03s"
perspect = [233, 30]

grid = pygmt.datasets.load_earth_relief(resolution=res, region=reg)

fig = pygmt.Figure()
fig.grdview(
    grid=grid,
    perspective=perspect,
    #frame=["xa", "yaf", "WSnE"],
    projection="M10c",
    region=reg,
    zsize="1.5c",
    plane="0",
    surftype="s",
    cmap="geo",
)

fig.coast(
    perspective=perspect,
    shorelines="1p,black",
)

# Try to plot point on the map, but not working 
# Downtown Oakland: 37.80N 122.27W
fig.plot(
    x=-122.27,
    y=37.80,
    style="c0.25c",
    color='red',
    pen="thick",
    perspective=True, 
)

fig.colorbar(
    perspective=True, 
    frame=["a500", "x+lElevation", "y+lm"],
    position="JML+o0c/0c+w7c/0.5c"
)

fig.savefig("grdview_map.png")

From example 32 in GMT. I don’t know how to do it in pygmt.

# We now add borders. Because we have a 3-D plot, we want them to be plotted "at elevation".|
# So we write out the borders, pipe them through grdtrack and then plot them with plot3d.|
gmt coast $Rflag -Df -M -N1 | gmt grdtrack -Gtopo_32.nc -s+a | gmt plot3d $Rplot -JZ -p -W1p,white|

For the case of coastline at z = 0, you must add the z value in perspect:

perspect = [233, 30, 0] instead of perspect = [233, 30]

I tried changing the perspective to include z-value, but coastlines are still offset.

Also plot3d with z-value for point plots location correct relative to offset coastlines, but not relative to topography grdview. Result looks identical to the plot posted above

import pygmt
reg = [-123, -121.5, 36.75, 38.25]

# Resolution 15m, 03m
res = "15s"
perspect = [233, 30, 0]

grid = pygmt.datasets.load_earth_relief(resolution=res, region=reg)

fig = pygmt.Figure()
fig.grdview(
    grid=grid,
    perspective=perspect,
    #frame=["xa", "yaf", "WSnE"],
    projection="M10c",
    region=reg,
    zsize="1.5c",
    plane="0",
    surftype="s",
    cmap="geo",
)

fig.coast(
    perspective=perspect,
    shorelines="1p,black",
)

# Try to plot point on the map, but not working 
# Downtown Oakland: 37.80N 122.27W
fig.plot3d(
    x=-122.27,
    y=37.80,
    z=0,
    style="c0.25c",
    color='red',
    pen="thick",
    perspective=perspect, 
)

fig.colorbar(
    perspective=True, 
    frame=["a500", "x+lElevation", "y+lm"],
    position="JML+o0c/0c+w7c/0.5c"
)

fig.savefig("grdview_map.png")

Is there a python equivalent to the command line piping solution in example 32?

Try this:

```
import pygmt
reg = [-123, -121.5, 36.75, 38.25]

# Resolution 15m, 03m
res = "15s"
perspect = [233, 30]

grid = pygmt.datasets.load_earth_relief(resolution=res, region=reg)

fig = pygmt.Figure()
fig.grdview(
    grid=grid,
    perspective=perspect,
    #frame=["xa", "yaf", "WSnE"],
    projection="M10c",
    region=reg,
    zsize="1.5c",
    plane="0",
    surftype="s",
    cmap="geo",
)

fig.coast(
    perspective=perspect, 0
    shorelines="1p,black",
)

# Try to plot point on the map, but not working 
# Downtown Oakland: 37.80N 122.27W
fig.plot3d(
    x=-122.27,
    y=37.80,
    z=0,
    style="c0.25c",
    color='red',
    pen="thick",
    perspective=perspect, 
)

fig.colorbar(
    perspective=True, 
    frame=["a500", "x+lElevation", "y+lm"],
    position="JML+o0c/0c+w7c/0.5c"
)

fig.savefig("grdview_map.png")
```

This gives syntax error for fig.coast() it cannot understand argument to perspective

I add the 0 value to the perspective only for the coast. This is what a usually do in gmt. Maybe I write wrong the syntax.

Maybe this will work:

fig.coast(
    perspective= [233, 30, 0]
    shorelines="1p,black",
)

No, tried it already

Problem resolved. I needed to specify 3D region for 3D perspective plotting (reg_plot for 3D and reg for 2D). gmt coast works without having to to track coast onto topography

Here is the complete working example

import pygmt

# Load sample earth relief data
# SFBA
reg = [-123, -121.5, 36.75, 38.25]
reg_plot = [-123, -121.5, 36.75, 38.25, -3000, 3000]

# Resolution 15m, 03m, 01m
res = "15s"
#res = "03s"

# Prespective
perspect = [233, 30]

grid = pygmt.datasets.load_earth_relief(resolution=res, region=reg)
#grid.to_netcdf("sfba_topo.nc")


fig = pygmt.Figure()

fig.grdview(
    grid=grid,
    perspective=perspect,
    #frame=["xa", "yaf", "WSnE"],
    projection="M10c",
    region=reg_plot,
    zsize="1.5c",
    plane="0",
    surftype="s",
    cmap="geo",
)

fig.coast(
    region=reg_plot,
    perspective=[233, 30, 0],
    shorelines="1p,black",
)

# Downtown Oakland: 37.80N 122.27W
fig.plot3d(
    x=-122.27,
    y=37.80,
    z=0,
    style="c0.25c",
    color='red',
    pen="thick",
    perspective=perspect, 
)

fig.colorbar(
    perspective=True, 
    frame=["a500", "x+lElevation", "y+lm"],
    position="JML+o0c/0c+w7c/0.5c",
)

fig.savefig("grdview_map.png")
2 Likes

Thanks @Esteban82 for pointing me to example 32 in GMT

You are welcome. I forgot about region and region3d.