Working with GMT 6.1.1 (classic mode)
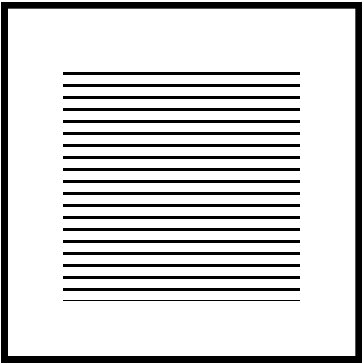
I am trying to plot a pattern fill as an overlay over another map. To do, this I would use gmt grdview with a categorial cpt containing the pattern information. Unfortunately, the result comes out as solid black fill (see image attached), no matter what do to change the pattern fill specification, resolution, etc. Consider the following simplification of my plotting script:
#!/bin/bash

module load GMT

cat << END > pattern.cpt
0 p5+r200
END

gmt grdmath -R0/3/0/3 -r -I1 0 = test.nc

gmt psbasemap -R0/3/0/3 -JX3 -B0 -P -K > test.ps

gmt grdview test.nc -R -J -T+s -Cpattern.cpt -O -P >> test.ps

gmt psconvert -A -Tg test.ps
gmt psconvert -A -Tf -Z test.ps
The result of this script gives me this image:

Does anyone else have this problem?
Thanks, Jed
I think that your file it has not a format of a (categorical) CPT. Do you see any warning message in the terminal?
0 p5+r200
I do not get any warnings during the script execution. You can also try it with a regular cpt; the behavior is the same.
The CPT is OK. I try with a regular color and it worked
cat << END > pattern.cpt
rem	0 red
rem	END

I try with the pattern and I get your figure. So I think that it is a bug.
I also try with modifying grdview and with this command I get a pattern (but I think it is not what you want):
gmt grdview test.nc -R -J -Qs -Cpattern.cpt -O >> test.ps -Vi -JZ1c


BTW, you could replace these commands:
gmt psconvert -A -Tg test.ps
gmt psconvert -A -Tf -Z test.ps
with this:
gmt psconvert -A -Tfg -Z test.ps
Thanks for confirming this unexpected behavior @Esteban82. Bug report filed here.
1 Like
Thanks @jedokaplan, now fixed in master.
I can confirm that the fix for the bug described above is now working properly, however, I still have an issue using grdview -T+s when the overlay .nc file I want to plot is large. Consider the following simplified example:
#!/bin/bash

gmt gmtset GMT_VERBOSE i

cat << END > pattern.cpt
0 p5+r200
END

gmt grdmath -R-180/180/-40/40 -fg -r -I1 0 = test.nc

gmt psbasemap -Rtest.nc -JX20/10 -B0 -P -K > test.ps

gmt grdview test.nc -R -J -T+s -Cpattern.cpt -O -P >> test.ps

gmt psconvert -A -Tf test.ps
When I execute this script, the plotting is fast, but gmt hangs on the psconvert step. It appears to take a very long time to calculate the map BoundingBox (about 45 seconds) on my machine. The actual conversion step to pdf is faster, although still pretty slow. If I increase the domain of the input .nc to, e.g., -Rd, psconvert takes so long to compute the BoundingBox that I thought the script was hanging, although it appears that it actually isn’t - it takes about 1m30s to calculate the BoundingBox and then another 15s or so to convert to PDF.
Is this the expected behavior and could there be any way to make this process faster? I have been thinking about converting my overlay raster into a polygon for example, but maybe there are other ways.
Thanks,
Jed
The slowness is entirely caused by ghostscript. Perhaps the algorithm it is using to deal with patterns is sub-optimal. We can try to submit an issue with ghostscript to see if they can find ways to speed it up.


