Hi,
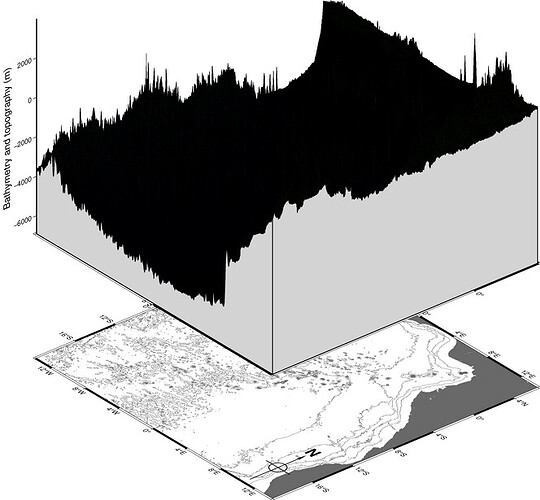
Please, I want a mesh plot showing the bathymetry of my region of interest. When i run the script below i get black mesh plot instead of a rainbow or geo mesh. What am I doing wrong? Pardon my ignorance please.
gmt begin 3D png
gmt grdcontour my_gog.nc -Wthinnest,dimgray -C1000 -Gd3c -A1000+f4+o -p130/30
gmt coast -p -B4 -BNESW -Gdimgray -TdjBR+o0.3c+w3c+l
gmt grdview my_gog.nc -I+a15+ne0.75 -R-13.9/14/-19.9/6.4/ -JZ4i -p130/30 -Cgeo.cpt
-N-6916+glightgray -Qsm -BnSwEZ+b -B2000 -Bz2000+l"Bathymetry and topography (m)" -Y3i
gmt end
