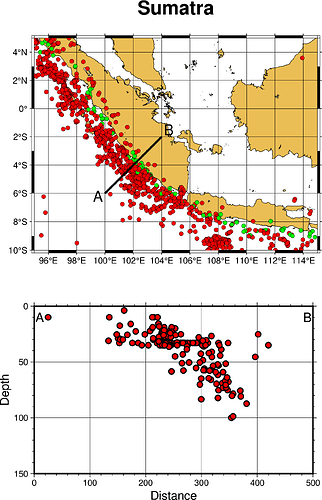
Hi @agusms, thanks for providing the script and data! The code is as below.
Original GMT cross.bat script:
rem To plot eq and cross-section

gmt makecpt -Cred,green,blue -T0,70,300,10000 > quakes.cpt

gmt begin sumatra pdf
  echo 100 -6 >line
  echo 104 -2 >>line
  echo 99.5 -6.2 A > word
  echo 104.5 -1.5 B >> word
  gmt coast -R95/115/-10/5 -JM4i -Bxa2g2 -Bya2g2pf3   -Glightbrown -B+t"Sumatra"  -W0.25p
  gmt plot eq.dat -Wfaint  -Sc0.15 -Cquakes.cpt
  gmt psxy  line   -JM  -W2
  gmt text word -JM -F+f15,Helvetica

  gmt project eq.dat -Q -C100/-6.0 -E104.0/-2 -Fpz -W-100/100 > cross.dat
  gmt basemap -JX10/-6 -R0/500/0/150 -Bxafg100+l"Distance"  -Byafg50+l"Depth" -BWSen -Y-8
  gmt psxy cross.dat -JX  -Sc0.2 -W1 -Gred
  echo 10 10 A > word2
  echo 490 10 B >> word2
  gmt text word2 -JX -F+f13,Helvetica

gmt end
Translated PyGMT v0.5.0 script:
import pygmt


fig = pygmt.Figure()

pygmt.makecpt(cmap="red,green,blue", series="0,70,300,10000", output="quakes.cpt")

fig.coast(
    region=[95, 115, -10, 5],
    projection="M4i",
    frame=["xa2g2", "ya2g2pf3", '+t"Sumatra"'],
    land="lightbrown",
    shorelines="0.25p",
)
fig.plot(data="eq.dat", pen="faint", style="c0.15", cmap="quakes.cpt")
fig.plot(x=[100, 104], y=[-6, -2], projection="M", pen=2)
fig.text(x=99.5, y=-6.2, text="A", font="15,Helvetica")
fig.text(x=104.5, y=-1.5, text="B", font="15,Helvetica")

pygmt.project(
    data="eq.dat",
    unit=True,
    center=[100, -6.0],
    endpoint=[104.0, -2],
    convention="pz",
    width=[-100, 100],
    outfile="cross.dat",
)
fig.basemap(
    projection="X10/-6",
    region=[0, 500, 0, 150],
    frame=['xafg100+l"Distance"', 'yafg50+l"Depth"', "WSen"],
    yshift=-8,
)
fig.plot(data="cross.dat", projection="X", style="c0.2", pen=1, color="red")
fig.text(x=10, y=10, text="A", font="13,Helvetica")
fig.text(x=490, y=10, text="B", font="13,Helvetica")

fig.savefig(fname="sumatra.pdf")
fig.show()
produces:
Hopefully you find it helpful!
Yes, but since you are just using 2 panels, it might be easier just to use xshift/yshift or fig.shift_origin. If you’re interested in making more complicated subplots, have a look at the tutorial at Making subplots — PyGMT.


