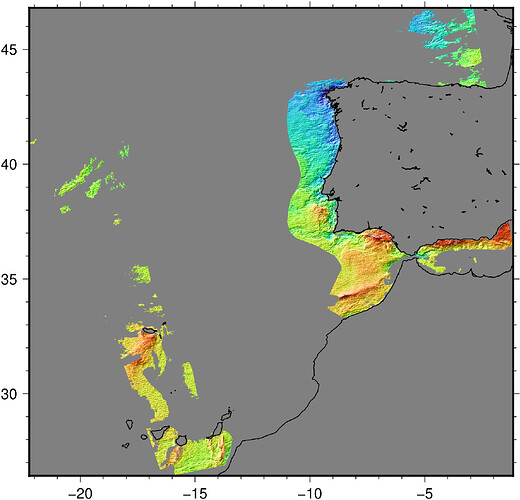
Hello Everyone 
I’m new in gmt, just started and still not able to understand how does it work.
I’ve been reading a lot but I can not find a solution to the problem I have, probably because of my inexperience, so I’d like to ask for your help. It’s mandatory for me to use GMT.
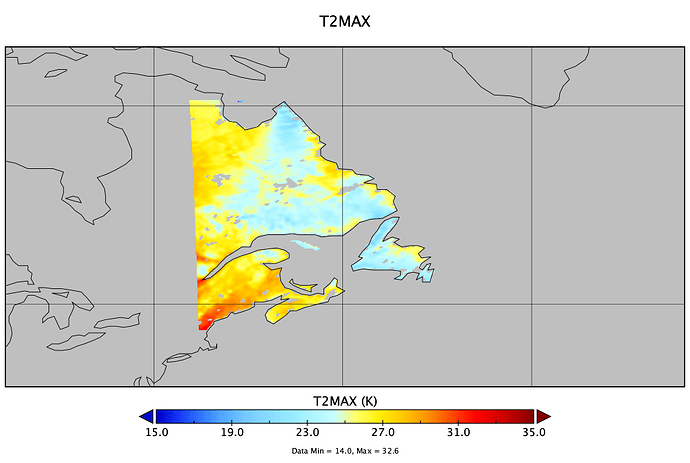
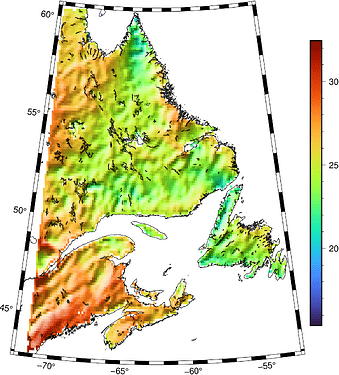
SO I need to plot a very simple NETCDF, 1 variable with long and lat in Lambert projection.
If I use panoply there is no problem at all, but I need to plot it fancier that in panoply using GMT.
But when I try to grd image using the following command:
gmt grdimage TXx-ccsmhis-annual-timavg.nc=gd -R-71/-30/43/60 -JL-65/52/60/50/7i -I+d
nothing happens but for the next warnings:
grdimage [WARNING]: Round-off patrol found north latitude outside valid range (230.5)!
grdimage [WARNING]: Your grid x's or longitudes appear to be outside the map region and will be skipped.
grdimage [WARNING]: No grid or image inside plot domain
SO i did a grdinfo to see whats’ happening:
grdinfo [WARNING]: "y", NetCDF: Variable not found
If something bad happens later, try importing via GDAL.
grdinfo [WARNING]: "x", NetCDF: Variable not found
If something bad happens later, try importing via GDAL.
TXx-ccsmhis-annual-timavg.nc: Title: longitude
TXx-ccsmhis-annual-timavg.nc: Command: Mon Mar 01 18:55:51 2021: cdo timavg TXx-ccsmhis-annual.nc TXx-ccsmhis-annual-timavg.nc
Mon Mar 01 18:54:04 2021: cdo yearmax t2max-ccsmhis.nc TXx-ccsmhis-annual.nc
Mon Mar 01 15:55:56 2021: cdo subc,273.15 t2max-parece-ccsm.nc t2max-ccsmhis.nc
Mon Mar 01 15:49:37 2021: cdo masklonlatbox,-71.5,-30,43,57.5 expo.nc t2ma
TXx-ccsmhis-annual-timavg.nc: Remark:
TXx-ccsmhis-annual-timavg.nc: Pixel node registration used [Cartesian grid]
TXx-ccsmhis-annual-timavg.nc: Grid file format: nd = GMT netCDF format (64-bit float), CF-1.7
TXx-ccsmhis-annual-timavg.nc: x_min: 0 x_max: 185 x_inc: 0.994623655914 name: n_columns: 186
TXx-ccsmhis-annual-timavg.nc: y_min: -0.5 y_max: 230.5 y_inc: 1 name: n_rows: 231
TXx-ccsmhis-annual-timavg.nc: z_min: 0 z_max: 0 name: longitude [degree_east]
TXx-ccsmhis-annual-timavg.nc: scale_factor: 1 add_offset: 0
TXx-ccsmhis-annual-timavg.nc: format: classic
I’m able to solve the two first WARNINGS using =gd to import it via GDAL but it’s basically the same without the warnings.
The problem is that x and y are number of columns and rows but looks like GMT take those as lon/lat, besides, the title is longitude(wtf? :)) and it should be T2MAX.
So GMT thinks that my domain starts on 0/0 till 186/231 in lat/lon but it doesn’t make any sense and cancel the show. Just for you too see this is what’s appears when I get info from CDO:
-1 :       Date     Time   Level Gridsize    Miss :     Minimum        Mean     Maximum : Parameter name
 1 : 2005-12-31 00:00:00       0    42966   30047 :      18.370      24.266      31.064 : T2MAX
cdo infon: Processed 42966 values from 1 variable over 1 timestep ( 0.01s )
No problem at all, same as with panoply.
So what can I do? Why is GMT not properly reading the coordinates of my NETCDF?
I’m attaching ncdump too:
netcdf TXx-ccsmhis-annual-timavg {
dimensions:
	x = 186 ;
	y = 231 ;
	Times = UNLIMITED ; // (1 currently)
variables:
	double XLONG(y, x) ;
		XLONG:standard_name = "longitude" ;
		XLONG:long_name = "longitude" ;
		XLONG:units = "degree_east" ;
		XLONG:_CoordinateAxisType = "Lon" ;
	double XLAT(y, x) ;
		XLAT:standard_name = "latitude" ;
		XLAT:long_name = "latitude" ;
		XLAT:units = "degree_north" ;
		XLAT:_CoordinateAxisType = "Lat" ;
	double Times(Times) ;
		Times:standard_name = "time" ;
		Times:units = "day as %Y%m%d.%f" ;
		Times:calendar = "proleptic_gregorian" ;
	float T2MAX(Times, y, x) ;
		T2MAX:units = "K" ;
		T2MAX:coordinates = "XLONG XLAT" ;
		T2MAX:_FillValue = -9.e+33f ;
		T2MAX:missing_value = -9.e+33f ;
		T2MAX:FieldType = 104 ;
		T2MAX:MemoryOrder = "XY " ;
		T2MAX:description = "MAXIMUM TEMPERATURE AT 2M HEIGHT IN DIAGNOSTIC OUTPUT INTERVAL" ;
		T2MAX:stagger = "" ;

// global attributes:
		:CDI = "Climate Data Interface version 1.6.1 (http://code.zmaw.de/projects/cdi)" ;
		:Conventions = "CF-1.4" ;
		:history = "Mon Mar 01 18:55:51 2021: cdo timavg TXx-ccsmhis-annual.nc TXx-ccsmhis-annual-timavg.nc\n",
			"Mon Mar 01 18:54:04 2021: cdo yearmax t2max-ccsmhis.nc TXx-ccsmhis-annual.nc\n",
			"Mon Mar 01 15:55:56 2021: cdo subc,273.15 t2max-parece-ccsm.nc t2max-ccsmhis.nc\n",
			"Mon Mar 01 15:49:37 2021: cdo masklonlatbox,-71.5,-30,43,57.5 expo.nc t2max-parece-ccsm.nc\n",
			"Mon Mar 01 15:48:50 2021: cdo ifthen aremap.nc T2MAX-ccsmhis-test.nc expo.nc\n",
			"Mon Mar 01 16:09:53 2021: cdo setgrid,variableoutgrid.txt T2MAX-ccsmhis.nc T2MAX-ccsmhis-test.nc\n",
			"Mon Mar 01 16:09:47 2021: cdo delete,timestep=578 T2MAX-test.nc T2MAX-ccsmhis.nc\n",
			"Mon Mar 01 16:09:27 2021: cdo cat wrfxtrmd021980.nc wrfxtrmd021980-2buena.nc wrfxtrmd021981.nc polla3.nc extraT2MAX1982.nc T2MAX1983.nc T2MAX1984.nc T2MAX1985.nc T2MAX1986.nc T2MAX1987.nc T2MAX1988.nc T2MAX1989.nc T2MAX1990.nc T2MAX1991.nc T2MAX1992.nc T2MAX1993.nc T2MAX1994.nc T2MAX1995.nc T2MAX1996.nc T2MAX1997.nc T2MAX1998.nc T2MAX1999.nc T2MAX2000.nc T2MAX2001.nc T2MAX2002.nc T2MAX2003.nc T2MAX2004.nc T2MAX2005.nc T2MAX-test.nc\n",
			"Mon Mar 01 16:08:55 2021: cdo selmon,01,02,03,04,05,06,07 -selname,T2MAX wrfxtrm_d02_1980-01-01_00:00:00 wrfxtrmd021980.nc" ;
		:TITLE = " OUTPUT FROM WRF V3.9.1 MODEL" ;
		:START_DATE = "1980-01-01_00:00:00" ;
		:WEST-EAST_GRID_DIMENSION = 187 ;
		:SOUTH-NORTH_GRID_DIMENSION = 232 ;
		:BOTTOM-TOP_GRID_DIMENSION = 27 ;
		:DX = 10000.f ;
		:DY = 10000.f ;
		:GRIDTYPE = "C" ;
		:DIFF_OPT = 1 ;
		:KM_OPT = 4 ;
		:DAMP_OPT = 3 ;
		:DAMPCOEF = 0.003f ;
		:KHDIF = 0.f ;
		:KVDIF = 0.f ;
		:MP_PHYSICS = 10 ;
		:RA_LW_PHYSICS = 24 ;
		:RA_SW_PHYSICS = 24 ;
		:SF_SFCLAY_PHYSICS = 2 ;
		:SF_SURFACE_PHYSICS = 4 ;
		:BL_PBL_PHYSICS = 2 ;
		:CU_PHYSICS = 3 ;
		:SF_LAKE_PHYSICS = 1 ;
		:SURFACE_INPUT_SOURCE = 3 ;
		:SST_UPDATE = 1 ;
		:GRID_FDDA = 0 ;
		:GFDDA_INTERVAL_M = 0 ;
		:GFDDA_END_H = 0 ;
		:GRID_SFDDA = 0 ;
		:SGFDDA_INTERVAL_M = 0 ;
		:SGFDDA_END_H = 0 ;
		:HYPSOMETRIC_OPT = 2 ;
		:USE_THETA_M = 0 ;
		:GWD_OPT = 1 ;
		:SF_URBAN_PHYSICS = 0 ;
		:SF_OCEAN_PHYSICS = 0 ;
		:WEST-EAST_PATCH_START_UNSTAG = 1 ;
		:WEST-EAST_PATCH_END_UNSTAG = 186 ;
		:WEST-EAST_PATCH_START_STAG = 1 ;
		:WEST-EAST_PATCH_END_STAG = 187 ;
		:SOUTH-NORTH_PATCH_START_UNSTAG = 1 ;
		:SOUTH-NORTH_PATCH_END_UNSTAG = 231 ;
		:SOUTH-NORTH_PATCH_START_STAG = 1 ;
		:SOUTH-NORTH_PATCH_END_STAG = 232 ;
		:BOTTOM-TOP_PATCH_START_UNSTAG = 1 ;
		:BOTTOM-TOP_PATCH_END_UNSTAG = 26 ;
		:BOTTOM-TOP_PATCH_START_STAG = 1 ;
		:BOTTOM-TOP_PATCH_END_STAG = 27 ;
		:GRID_ID = 2 ;
		:PARENT_ID = 1 ;
		:I_PARENT_START = 47 ;
		:J_PARENT_START = 27 ;
		:PARENT_GRID_RATIO = 3 ;
		:DT = 60.f ;
		:CEN_LAT = 51.22598f ;
		:CEN_LON = -59.66031f ;
		:TRUELAT1 = 60.f ;
		:TRUELAT2 = 50.f ;
		:MOAD_CEN_LAT = 52.f ;
		:STAND_LON = -70.f ;
		:POLE_LAT = 90.f ;
		:POLE_LON = 0.f ;
		:GMT = 0.f ;
		:JULYR = 1979 ;
		:JULDAY = 1 ;
		:MAP_PROJ = 1 ;
		:MAP_PROJ_CHAR = "Lambert Conformal" ;
		:MMINLU = "USGS" ;
		:NUM_LAND_CAT = 28 ;
		:ISWATER = 16 ;
		:ISLAKE = 28 ;
		:ISICE = 24 ;
		:ISURBAN = 1 ;
		:ISOILWATER = 14 ;
		:HYBRID_OPT = -1 ;
		:ETAC = 0.f ;
		:CDO = "Climate Data Operators version 1.6.1 (http://code.zmaw.de/projects/cdo)" ;
}
Thank you very very very very much for your help I’m waiting for your answers.
I would really appreciate any help 
Thanks
Marian


