Help w/ plot3d in pyGMT

I’m looking to create a perspective map with earthquakes plotted under topography at Mount Hood. I have the grdview command in a form I like, but plot3d is giving me issues. I’ve reduced the script to this simple set of commands which when plotted, only shows the basemap frame. Using pygmt 0.3.1 and gmt 6.1.1:

import pygmt
region =[-121.8,-121.6,45.27,45.43]
fig = pygmt.Figure()
fig.plot3d(x=-121.7, y=45.35, z=-1000,
           style="c10c", color="red", zscale="1.5c", perspective=[120, 15],
           projection="M8i", frame=["xa", "yaf", "wSnEZ"], region=region)
fig.show(method='external')

What am I missing? It is surely something simple.

Thanks,
Wes

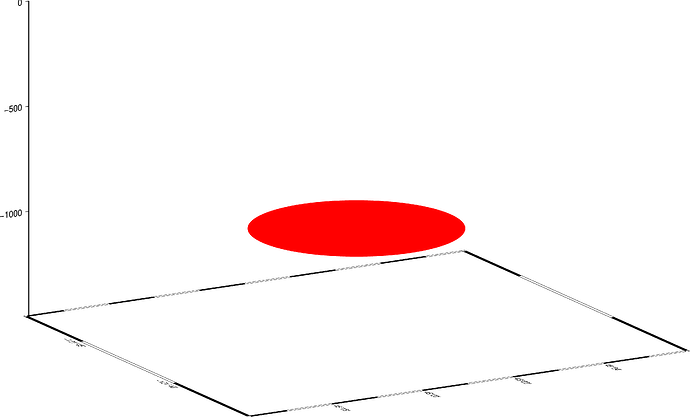
Hey Wes, you need to add zmin/zmax to your region. See modified code and plot below. Cheers.

import pygmt

REGION = [-121.8, -121.6, 45.27, 45.43, -1500, 0]

fig = pygmt.Figure()
fig.plot3d(
    x=-121.7,
    y=45.35,
    z=-1000,
    style='c10c',
    color='red',
    zscale='0.01c',  # This had to be reduced
    perspective=[120, 15],
    projection='M8i',
    frame=['xa', 'yaf', 'za', 'wSnEZ'],  # I added 'za' to annotate the z-axis
    region=REGION,
)
fig.show(method='external')

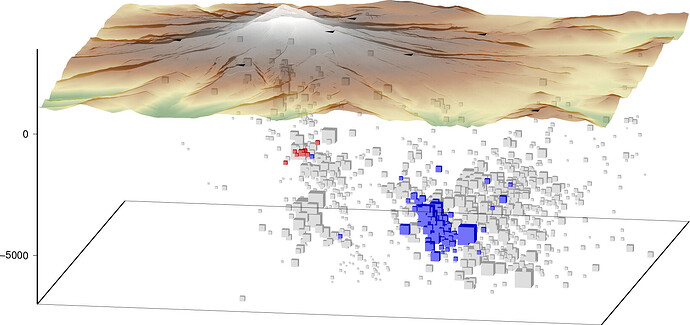
That definitely did the trick. Many thanks. I’m posting the code and the resulting plot here in case anyone else is interested in using it for their own plot. Hopefully it will save someone some time.

region =[-121.8,-121.6,45.27,45.43,-7000,3500]
perspective=[260,12]
fig = pygmt.Figure()

# Configuration for the 'current figure'.
pygmt.config(MAP_FRAME_TYPE="plain")
pygmt.config(FORMAT_GEO_MAP="ddd.xx")
pygmt.config(FORMAT_FLOAT_OUT='%.12lg')

cutgrd = pygmt.grdcut(grid=grd, region=region, projection="M8i")
# All seismicity
fig.plot3d(x=eqLonAll,
           y=eqLatAll,
           z=-1000*np.array(eqDepAll),
           sizes=0.1 * (2**np.array(eqMagAll)),
           style="uc",
           color="gray",
           zscale="0.001c",
           perspective=perspective,
           projection="M8i",
           #frame=["xa", "yaf", "za", "wSnEZ"],
           region=region)
# Summit swarm
fig.plot3d(x=eqLon,
           y=eqLat,
           z=-1000*np.array(eqDep),
           sizes=0.1 * (2**np.array(eqMag)),
           style="uc",
           color="red",
           zscale="0.001c",
           perspective=perspective,
           projection="M8i",
           #frame=["xa", "yaf", "za", "wSnEZ"],
           region=region)
# Flank swarm
fig.plot3d(x=eqLonF,
           y=eqLatF,
           z=-1000*np.array(eqDepF),
           sizes=0.1 * (2**np.array(eqMagF)),
           style="uc",
           color="blue",
           zscale="0.001c",
           perspective=perspective,
           projection="M8i",
           #frame=["xa", "yaf", "za", "wSnEZ"],
           region=region)

fig.grdview(
    grid=cutgrd,
    perspective=perspective,
    #frame=["xa", "yaf", "za", "wSnE"],
    projection="M8i",
    zscale="0.001c",
    # Set the surftype to "surface"
    surftype="s",
    shading="+a45",
    # Set the CPT to "geo"
    cmap="geo",
    region=region,
    transparency=20
)

fig.plot3d(x=stalon,
           y=stalat,
           z=staelev,
           style="t0.5c",
           color="black",
           zscale="0.001c",
           perspective=perspective,
           projection="M8i",
           #frame=["xa", "yaf", "za", "WsNeZ"],
           frame=["za", "WsNeZ"],
           region=region)

fig.show(method='external')
6 Likes

Hi,wthelen ,thanks for your shearing!
But when I ran the code,it‘s appear"
cutgrd = pygmt.grdcut(grid=grd, region=region, projection=“M8i”)
NameError: name ‘grd’ is not defined
So I Wanna your advice,thank you very much

Hello and welcome! Wes is using a variable grd to point to the actual grid file / etc. he’s using. So you’ll need to ask him for the file, or find a suitable alternative for your study area.

So, all I need to do is put a file named “grd. grd " in the folder where " .py” is located. I’m a beginner to PyGMT, so perhaps I’m new to all this. Thank you Liamtoney

No, you must have a line of the form

grd = '/path/to/my/data.grd'

which is then passed to the function. data.grd is your gridded data file.

Good, It’s a very detailed solution, thank you, liamtoney