My goal is to create digital bottom models from depth points and lake shorelines. The final format should be GeoTIFF and CRS the same as for the source data, EPSG:3067 which is almost the same as UTM zone 35.
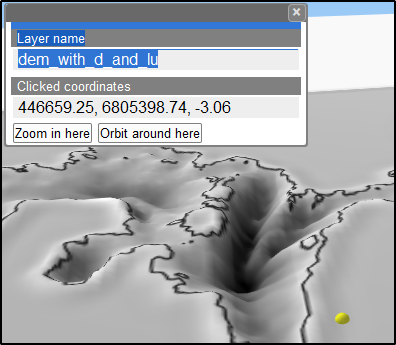
I have now managed to create a somewhat usable result with command gmt surface depth_points.xyz -R443231.881/448359.631/6803096.632/6808575.009 -I10 -Dlakepoly.gmt -Lu0 -Gdem_with_d_and_lu.nc
However, the algorithm creates a wall along the shoreline and dry land gets elevations below the lake surface. Values greater than zero I could cut with the parameter “-Lu0” but I can’t cut negative heights because they appear in the real depth data.
I was suggested to mask the land area by running surface with parameter -M but it does not work with this kind of data where the measurements have been done in lines with 60-70 meters apart which means that the value of M must be at least 35 meters.
Is there any other GMT tool that can be used for making an exact mask by the lake polygon? The area that is not lake should get either height=0 or nodata. I know how to do that with gdal_rasterize but some native GMT way might make scripting easier.
I was not sure how to apply CRS for the source datasets correctly so I just dropped CRS. However, my aim is to make georeferenced so I would appreciate a hint about how to define CRS correctly for my datasets. Also it would be nice if I could save the result directly into GeoTIFF format it that is possible.
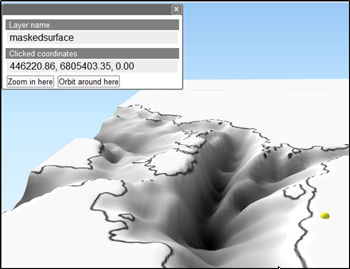
Yes. run grdmask with the same -R -I as surface and use -N to set the inside of the lake to NaN and the outside to 1, then do
gmt grdmath yoursurface.grd mask.grd MUL - maskedsurface.grd
Jukka, regarding the file format, GMT lets you save the file directly in GeoTiff (see it here). Basically it would be something like -Gdem_with_d_and_lu.tif=gd:GTiff but it won’t carry the CRS info. For that I’m afraid that you’ll have to do a three steps procedure.
Let it save the grid in netCDF
Use grdedit -J to assign a CRS to the grid. Here you can use the proj4 syntax. E.g. -J"+proj=utm +zone=…", or without double quotes and spaces, -J+proj=utm+zone=…
Use grdconvert to convert from netCDF to GeoTiff
Or use gdal to assign the -s_srs to the GeoTiff generated by surface
Thanks, pwessel. The result is pretty nice now. Some small islands are below the surface but I guess that grid spacing of 10 m is too much for my data and I have not been playing with tension so far.
No, I don’t know of any tool to estimate the best grid spacing from the point data (and I’m not talking GMT only). Basically one should use a grid spacing close to the data points spacing (and this can be quite heterogeneous). I looked into your data set with a graphical tool and see that typical point spacing is around ~15 m, so I would use -I15
The origin of this data is echo sounder measurement and typically the distance between the points along the lines is about 0.5-2 m but the lines are 20-100 m apart. From my test data most points from the echo sounder are filtered out and the remaining points have quite even spacing. Distances between the remaining points are 10-20 m and between the lines about 40-80 m.
By reading this ESRI storymap Interpolation of Data Collected along Lines it feels that the algorithm used in surface may not be optimal for echo sounder data. The authors are recommending two methods:
empirical Bayesian kriging (EBK) with a power semivariogram model.
local polynomial interpolation (LPI) and its variant, kernel interpolation with barriers.
Does GMT support interpolation methods like those two, or do you think that the “adjustable tension continuous curvature splines method” is ok even for data that are collected along lines?
No, there are no such algorithms in GMT, but I think surface is perfectly suited to calculate a grid with your data set. As a rule, to use surface and if the choice of -I is such that several points of the input dataset fall inside one grid node, then you should pre-process the data with blockmedian. With spacing of ~-I10 it probably won’t make a difference but it also doesn’t cost much to try.
That said, it would be nice if we could compare the grids produced by surface and one calculated with those algorithms.