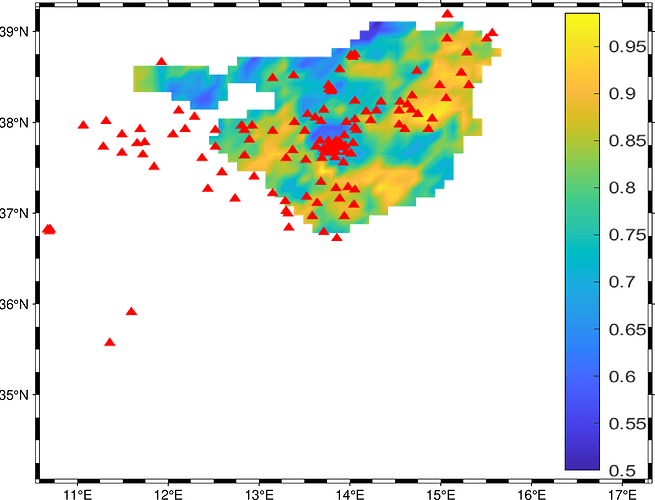
I have processed a .tiff image in Matlab and I would like to plot it with the coasts and the longitude and latitude grid. How can I do it using your program?
Hi Anna.
If your image is in long and lat, then you could treat it as a grid.
b_pictures_out_gulia_07_15_30_100.tif (228.0 KB)
my figure is in this way
super thanks
map.pdf (121.1 KB)
this is what i obtained by this code
gmt begin map
# Visualizzare l'immagine raster della Sicilia
gmt grdimage b_pictures_out_gulia_07_15_30_100.tif -Cmy_palette.cpt -I+d -Q50 -R11.50894/15.77485/35.27988/39.50000 -JM5i

# Sovrapporre le linee costiere della Sicilia sull'immagine raster
gmt coast -R11.50894/15.77485/35.27988/39.50000 -Wthin  -JM5i -Bafg -W0.5p,black  -I1

gmt end
the .tiff is not in the correct position. How can move ?
You should not include a region (-R) in your coast command, because that will draw the coastline with a different region from your image.
That is not the problem here because the -R region is the same in the commands (though it should not be repaeted). The problem looks more on the -tif file that seems to have wrong coordinates.
the .tif file is an RGB image including the color bar
no wonder the coordinates are off
thanks you so much.
i try to fix the coordinates.
