How can I put the coordinates annotion inside the Frame?

Hi,

In PyGMT, I would like to display the coordinates inside the frame rather than outside to save space, but it’s not working properly. Could anyone help me resolve this issue?

I did use the

# Initialize the PyGMT figure
fig = pygmt.Figure()
# Configuration for the 'current figure'.
pygmt.config(MAP_FRAME_TYPE="inside") 

However, the frame disappear in a strange way.

Cheers,
Muhammet Nergizci
PhD Student

Ah, I realized that after configuring the MAP_FRAME_TYPE as “inside,” the coordinates didn’t disappear. However, now the coordinates are positioned at the bottom of the grid files.

The solution is the re-plot the basemap at the end of the code again to bring coordinates and ticks to the top like:

Hello @muhammetnergizci,

I am a bit confused about what is / was not working correctly.
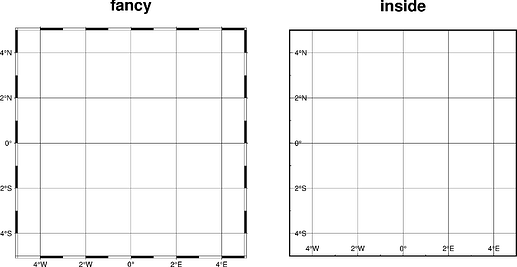
What do you mean by “the frame disappears”? Maybe that the frame does not have these alternating black/white strips anymore after changing to "inside"?
An overview of the available frame types can be found at gmt.conf — GMT 6.5.0 documentation.

import pygmt

size = 5

fig = pygmt.Figure()

pygmt.config(MAP_FRAME_TYPE="fancy")
fig.basemap(region=[-size, size] * 2, projection=f"M{size*2}c", frame=["afg", "+tfancy"])

fig.shift_origin(xshift="+w+2c")

pygmt.config(MAP_FRAME_TYPE="inside")
fig.basemap(region=[-size, size] * 2, projection=f"M{size*2}c", frame=["afg", "+tinside"])

fig.show()

Hi Yvonne,

Thanks for your reply. Let me clarify, as this might be helpful for anyone who encounters the same issue:

I defined the frame type as “inside,” following your example, and it works fine. However, the problem arises when you add other plotting elements (fig.grdimage etc. )—the figure overlaps the frame annotations, causing the annotations to be hidden underneath, making the coordinates invisible. To solve this, I re-defined the fig.basemap at the end of the code like this:

fig = pygmt.Figure()

Configuration for the ‘current figure’.

pygmt.config(MAP_FRAME_TYPE=“inside”)

fig.basemap(region=plot_region, projection=“X10c/12c”, frame=[“xa1f1”,“ya1f1”, “WSen”])

Create a color palette with blue for water and gray for land

pygmt.makecpt(cmap=“gray”, series=[-22000, 9000, 3000], continuous=True)

Add DEM relief background using the locally saved file

fig.grdimage(grid=dem,cmap=True,region=region,shading=True,frame=False)

fig.basemap(region=plot_region, projection=“X10c/12c”, frame=[“xa1f1”,“ya1f1”, “WSen”])

You can directly define the basemap at the bottom but it would be a problem for defining the region, and subplotting, therefore I re-define double times and the problem solved in this way. If there is more easy and professional way happy to try that as well!

Cheers,
Please, format your posts (wrap them under triple back ticks)

With this you can avoid both calls to basemap

fig.grdimage(grid=dem,cmap=True, region=region, projection=“X10c/12c”, shading=True, frame=[“xa1f1”,“ya1f1”, “WSen”])
1 Like