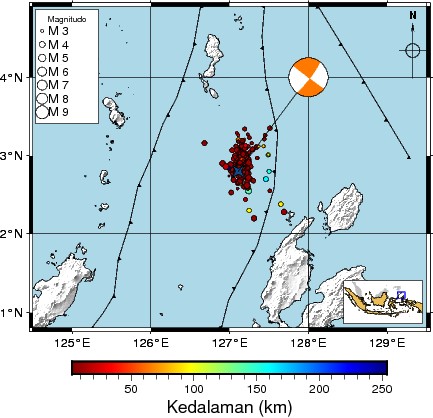
Hai sir Seisman…
below here my script Pygmt
import pygmt
import pandas as pd

#Read Data gempa susulan
data = pd.read_csv('plot2.csv')
#Read Data gempa utama
data2 = pd.read_csv('gempa_utama.csv')

#Region
minlon, maxlon = 124.5,129.5 #defenisikan batas geografis longitude
minlat, maxlat = 0.8,4.9 #defenisikan batas geografis latitude
region = [minlon,maxlon,minlat,maxlat]

#Buat CPT
fig = pygmt.Figure()
pygmt.makecpt(
    cmap='jet',
    #series='-8000/5000/1000',
    continuous=True)
# load data Topo
topo_data = "@earth_relief_30s"
# plot high res topography
fig.grdimage(grid=topo_data,
             region=region,
             projection='M10c',
             shading=True,
             frame ='ag2.0')
#Plot garis pantai
fig.coast(shorelines='0.25p,black',
          water='lightblue',
          frame ='ag2.0')

# fig.coast(region=region,
#           projection='M10c',
#           frame = 'ag2.0',
#           shorelines='0.25p,black',
#           #land='grey',
#           water='lightblue')

#Plot Trace subduction Sulawesi and fault
fig.plot(data ='sub_sulawesi_hayes-2018.txt', pen="0.4p", style="f1c/0.07c+r+t", color="black")
fig.plot(data ='philiphine_hayes.txt', pen="0.4p", style="f1c/0.07c+r+t", color="black")
fig.plot(data='west_molucast_sea_pusgen-2017.txt',pen = '0.4p',style = 'f1c/0.07c+r+t',color ='black')
fig.plot(data='east_molucast_sea_pusgen-2017.txt',pen = '0.4p',style = 'f1c/0.07c+r+t',color ='black')
fig.plot(data='gorontalo_north_pusgen-2017.txt',pen = '0.4p',style = 'f5c/1c+l+s45+o2.25c',color ='black')
fig.plot(data='gorontalo_south_pusgen-2017.txt',pen = '0.4p',style = 'f5c/1c+l+s45+o2.25c',color ='black')

#Plot arrow dan scale bar
fig.basemap(rose="jTR+w1.4+lo,E,S,N+o-0.00001c/0.1c")
#              map_scale="jBL+w50k+o4.0c/0.36c+f")

#color ramp untuk kedalaman
pygmt.makecpt(cmap="jet", reverse = True,series=[data.depth.min(),data.depth.max()])
#pygmt.makecpt(cmap="depth.cpt")

#Plot Gempa Bumi susulan berdasarakan Kedalaman
fig.plot(x = data.longitude,
         y = data.latitude,
         size = 0.56**data.magnitude,
         pen ='faint',
         style ='c',
         color =data.depth,
         cmap = True)

#Plot colorbar Kedalaman gempa
fig.colorbar(frame='af+l"Kedalaman (km)"')

#Plot Gempa Bumi Utama
fig.plot(x = data2.longitude,
         y = data2.latitude,
         style ='kstar4/0.3c',pen='0.1p,black',
         color="dodgerblue4")

#Plot Data Focal Mechanisme
fig.meca(spec='focal_data.txt',
         convention='aki',
         scale ='0.7c',
         C = True, #panel
         offset = True)

#Menamabahkan inset Peta
with fig.inset(position="jBR+o0.1c",
               box="+gwhite+p0.07p",
               region=[95, 141, -11.3, 8.8],
               projection="U54S/2c",
):
    fig.coast(dcw="ID+glightbrown+p0.2p",
              land ='gray',
              area_thresh=10000,)
    rectangle = [[region[0], region[2], region[1], region[3]]]
    fig.plot(data=rectangle, style="r+s", pen="0.5p,blue")

#plot Legend Magnitudo
fig.legend(spec='magnitude_leg.txt',
           position='JTL+jTL+o0.07c+w1.6/2.9',
           box='+gwhite+p0.1p')

#Convert file ke PNG
#fig.savefig ("aftershock.png", crop=True, dpi=1000, transparent=True)
fig.psconvert(prefix='aftershock.jpeg',dpi=1000)


