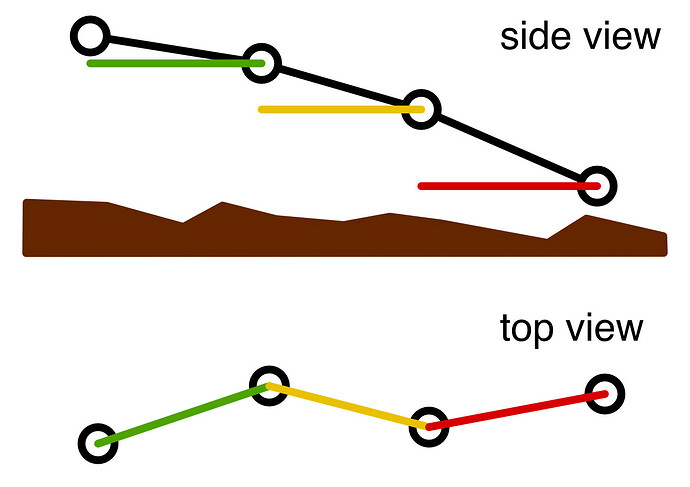
I try to plot aircraft tracks. I have a bunch of coordinates with altitude information and I want to color the segments between the points according to their altitude. See the superbly executed illustration below.
I’m aware of -Z but as I understand it this doesn’t really help in my case.
My idea is to pass plot a CPT and have it color the line segments accordingly. As every data point might have a different altitude associated with it I want to use the lower value of two consecutive points for choosing the color. To make things worse, in a different context I’m interested in the higher value.
Is there a way to achieve this with pure GMT?
Thank you and all the best,
Kristof
Something to play with:
track_sample_data.txt (19.6 KB)
In the sample data the altitude information (z-value) is in column 3 (the first column being column 0).
#!/usr/bin/env bash

gmt begin track_sample
  gmt plot \
    -R007:24:13.64/49:01:59.90/009:54:13.64/51:01:59.90r \
    -JL008:34:13.64/50:01:59.90/49:31:59.90/50:31:59.90/20c \
    track_sample_data.txt -i7,6 -W0.7p,red
gmt end
Isn’t it a job for categorical CPT ?
Hi @PlanetGus, thank you for taking the time to answer. A categorical CPT isn’t really needed. I’m spanning values from ~37.000ft almost all the way to 0ft. I just want to qualitatively show the altitude in a 2D top view.
My problem is how to get this z-value out of the data.
In the end the idea is to highlight areas where aircraft regularly come close to terrain. But that will be a second step to convert the altitudes into height above terrain.
I think this is a job for gmt convert -Fv. I see your input file has text before numerical columns so maybe need awk to select lon,lat,altitude but if you have that then the above command will turn records of lon,lat,alt into records with lon1,lat1,alt1,lon2,lat2,alt2 and you can use that with plot -Sv1p+s -W1p+cl -Cyour.cpt -i0,1,3,4,2|5 depending if you want the first or second point to set the color.
Actually, this seems to work:
gmt convert track_sample_data.txt -i7,6,3 -Fv -o0,1,3,4,2
and you can change the last 2 to 5 (assuming I used the right column for altitude). Pipe through plot as shown earlier
I tried something with -S~ , but I was not able to color it properly. -Sc seems to work but I reckon it’s not ideal :
gmt begin test png
    gmt makecpt -T0/20000/1000 -H > mycpt.cpt
    gmt plot -R007:24:13.64/49:01:59.90/009:54:13.64/51:01:59.90r -JL008:34:13.64/50:01:59.90/49:31:59.90/50:31:59.90/20c track_sample_data.txt -i7,6,3 -Sc0.25c -Cmycpt.cpt -Bafg
gmt end show
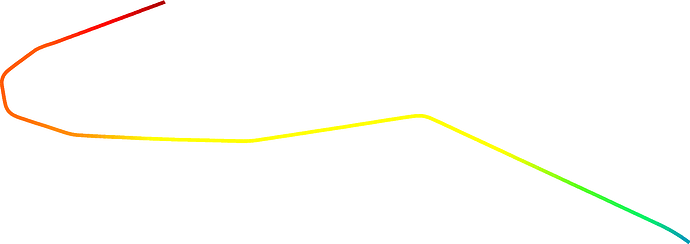
Thank you @pwessel! gmt convert and -Sv+s -W+cl did the trick. Great idea converting the segments to vectors.
track_sample_data.txt (19.6 KB)
#!/usr/bin/env bash

gmt makecpt -T0/20000 -Cseis > track.cpt
gmt convert track_sample_data.txt -i7,6,3 -Fv -o0,1,3,4,2 > trackv.txt

gmt begin track_sample
  gmt plot \
    -R007:24:13.64/49:01:59.90/009:54:13.64/51:01:59.90r \
    -JL008:34:13.64/50:01:59.90/49:31:59.90/50:31:59.90/20c \
    trackv.txt -Sv1p+s -W2p+cl -Ctrack.cpt -i0,1,4,2,3
gmt end
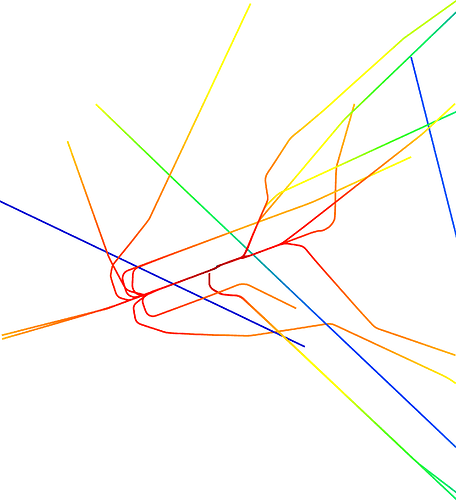
Just some eye-candy with more tracks:
The idea @PlanetGus brought up with just plotting symbols and colouring them via z-value is quite clever as well. While not ideal in this case it is a useful trick to know. Thank you for that!
2 Likes
Quick question for @pwessel, @PlanetGus and the other devs:
Is this useful enough to qualify for becoming an example? Besides plotting aircraft tracks it might also be useful for users tracking animals like migrating birds or whales. Could also be used for visualising speeds in racing or similar.
1 Like
I’m not a dev, but I like your script 
I definitely would adapt it to flow speed (ice, river … ) when grdimage is not an option.
Moreover, the script is already there, it might as well be copied in showcase 
Glad you like it! I feel that it is too simple for the showcase. I thought of this one being more of a quick and dirty example how to color-code the z-value into a plot.
In my eyes the showcase should be reserved for beautiful and complicated visualisations showing off what can be accomplished with GMT. A line with a color gradient isn’t that flashy in this context …
I think it’s worth to be there, but if you feel like it’s not enough, turn it into a movie with (x,y) plane on the left and (t,z) plane on the right , call it “Flight tracking to avoid tragic collision” and tadam ! Sensational science 
Actually the “line with a color gradient” is a small step in a bigger project where I try to locate potential hotspots where flights in controlled airspace and flights in the adjacent uncontrolled airspace regularly come close to each other. Not in a sensational “barely avoided tragic collision” sense but more as way to raise situational awareness amongst the pilots. This might qualify for the showcase when finished. So far I spent half of last night fighting with gmtselect and gmtmath.
What I like about showcase category, is not necessarily to see fancy stuff, but also to see how versatile GMT could be, how people are using it in different fields 
I spent half of last night fighting
Ah ! overnight projects  I like these unhealthy ones
For hotspots, maybe have a look at “how to create a heatmap” in … showcase  (also the reply from PWessel on how to improve it down the thread.
1 Like
That heat map idea is great! I smell feature creep in my project goals … 
I think we are fine having almost anything in the showcase. The alternative is simple that it wont have many examples, so go for it!
I agree, that would be a proper place for it 
Great to see your new forum posts @KristofKoch! Hope you’re well 
I agree that it would make a great example 
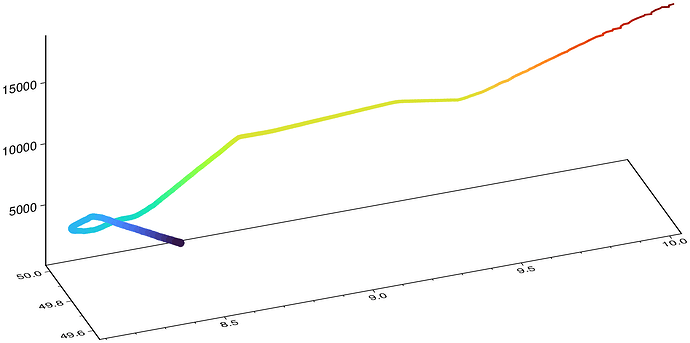
Same fig but this times as seen from Kristof’s cockpit.
julia> D = gmtread("track_sample_data.txt", i="7,6,3");
julia> plot3d(D, lc=:gradient, lt=[1,5], par=(PS_LINE_CAP="round",), show=true)
1 Like


