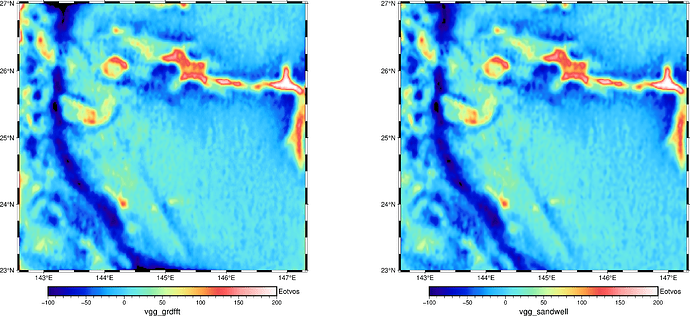
Hi, I find gravfft has the function to calculate the Vertical Gravity Gradient (VGG). But hard to understand the help file.
Could someone give me help in this topic?
Thanks
Lei
Hello,
To get the vertical derivative just use grdfft with the -D option. Remember to pad the grid (-N option) to avoid edge effects; usually 2nx and 2ny should be fine.
Hope that helps
Lester
1 Like
Thanks,Lester
This work good. I share the GMT code here for anyone might use.
Compute VGG from GA using grdfft
!gmt grdfft grav1.nc -D -N2x/2y -V -Ggrav_2nd_derivative.nc
Here is the plot code. The UNIT of VGG is Eotvos and need a transform with the GMT result.
import pygmt
import xarray as xr

# Define original grid file and scaled grid file
original_grid = "grav_2nd_derivative.nc"
scaled_grid = "grav_2nd_derivative0_scaled.nc"
second_grid = "curv_31.1.nc"

# Load and scale the first grid data
ds1 = xr.open_dataset(original_grid)
data1 = ds1['z'] * 10000  # Assuming 'z' is the data variable

# Load the second grid data
ds2 = xr.open_dataset(second_grid)
data2 = ds2['z']  # Assuming 'z' is the data variable

# Define color map minimum and maximum values
cmap_min = -100
cmap_max = 200
print(f"Color map range: {cmap_min} to {cmap_max}")

# Create custom CPT (Color Palette Table)
pygmt.makecpt(cmap="haxby", series=[cmap_min, cmap_max], continuous=True, output="custom.cpt")

# Save the scaled first grid data to a new NetCDF file
scaled_ds = data1.to_dataset(name='z')
scaled_ds.to_netcdf(scaled_grid)

# Create a new figure object
fig = pygmt.Figure()

# Plot the scaled first grid data using the custom CPT
fig.grdimage(
    grid=scaled_grid,            # Use the scaled grid
    projection="M15c",           # Mercator projection with a width of 15 cm
    region="142.6/147.3/23/27",   # Geographical region [xmin/xmax/ymin/ymax]
    frame=True,                  # Draw frame around the map
    cmap="custom.cpt",           # Use the custom CPT
)
fig.colorbar(
    frame=["af", "x+lvgg_grdfft", "y+lEotvos"]  # Customize colorbar labels
)
fig.coast(shorelines="0.5p,black")             # Draw coastlines with specified line width and color

# Shift the origin to plot the second layer side by side
fig.shift_origin(xshift="20c")

# Plot the second grid data using the same custom CPT
fig.grdimage(
    grid=second_grid,            # Use the second grid
    projection="M15c",           # Mercator projection with a width of 15 cm
    region="142.6/147.3/23/27",   # Geographical region [xmin/xmax/ymin/ymax]
    frame=True,                  # Draw frame around the map
    cmap="custom.cpt",           # Use the same custom CPT
)
fig.colorbar(
    frame=["af", "x+lvgg_sandwell", "y+lEotvos"]  # Customize colorbar labels
)
fig.coast(shorelines="0.5p,black")             # Draw coastlines with specified line width and color

# Display the figure with a width of 20 cm
fig.show(width="20c")

# Save the figure to a file named "vgg.png"
fig.savefig("vgg.png")
