I’m trying to create a cross-section visualization similar to
where I need to:
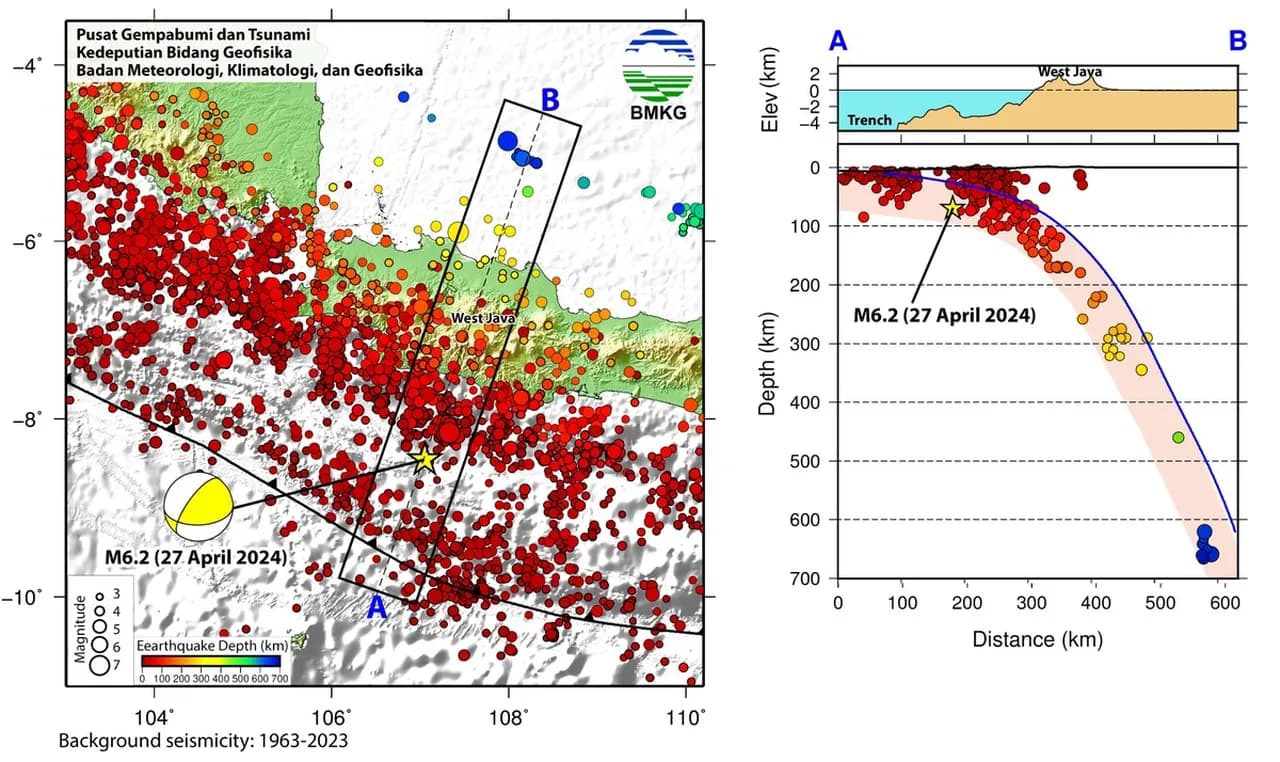
- Draw a line between two geographic points (A: 104.475°E,29.40°N to B: 104.492°E,29.38°N)
- Create a rectangle that extends 100 meters on each side of this line (total width 200m)
I know how to draw the basic line using:
  echo "104.475 29.40" > line.txt
  echo "104.492 29.38" >> line.txt
  gmt plot line.txt -W1.,black,--
But I’m unsure how to:
- Calculate the perpendicular offsets needed to create the rectangle
- Ensure the width is exactly 200 meters in real-world dimensions
- Close the polygon properly to form a rectangle
Would someone be able to provide a GMT 6.3 solution that creates this buffer around my line?