Hello brothers:
Sorry i’m a newbie for python and pygmt.
Now I am drawing a map showing precipitation in Hong Kong area. I only have data from some weather stations in Hong Kong including longitude 、 latitude and precipitation. By studying the manual, I’ll just color-code the precipitation for that stations,like this:

But I have two problems:①How to display only the range of Hong Kong, excluding other regions except Hong Kong?
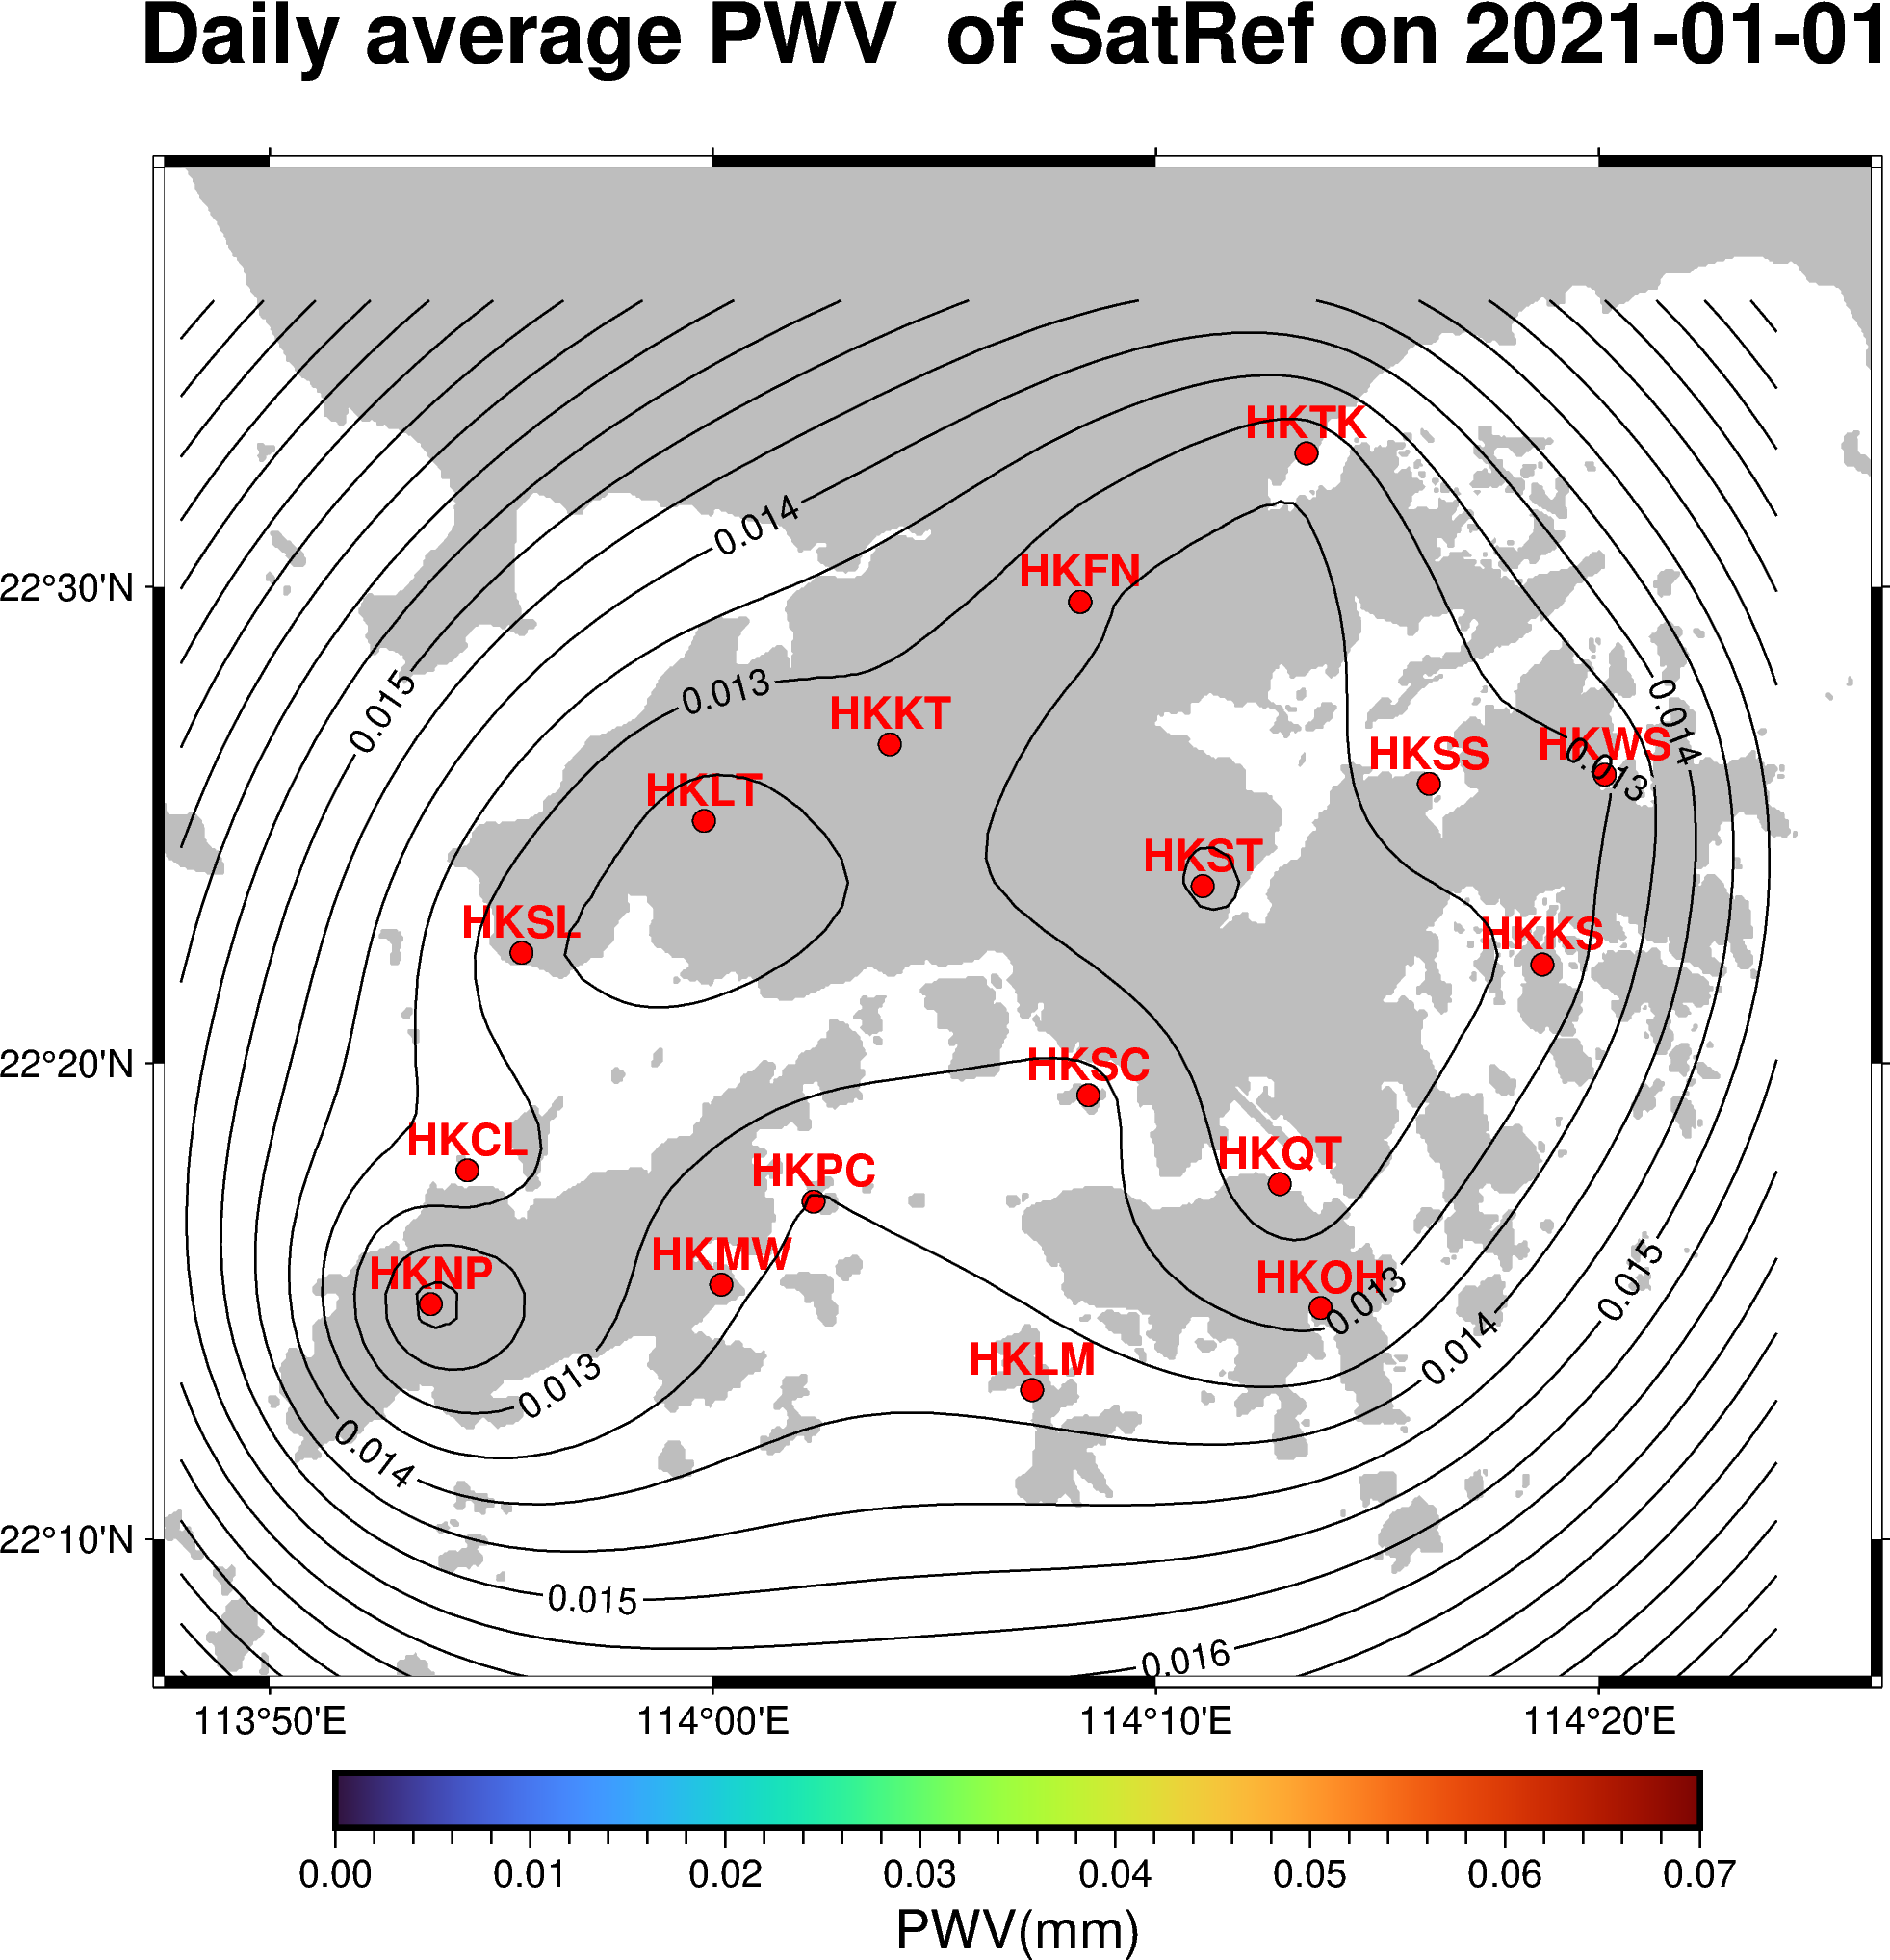
②How to plot the precipitation within Hong Kong using only the precipitation from those stations?like this:


What should I do?Thank you all!!