Hi all,
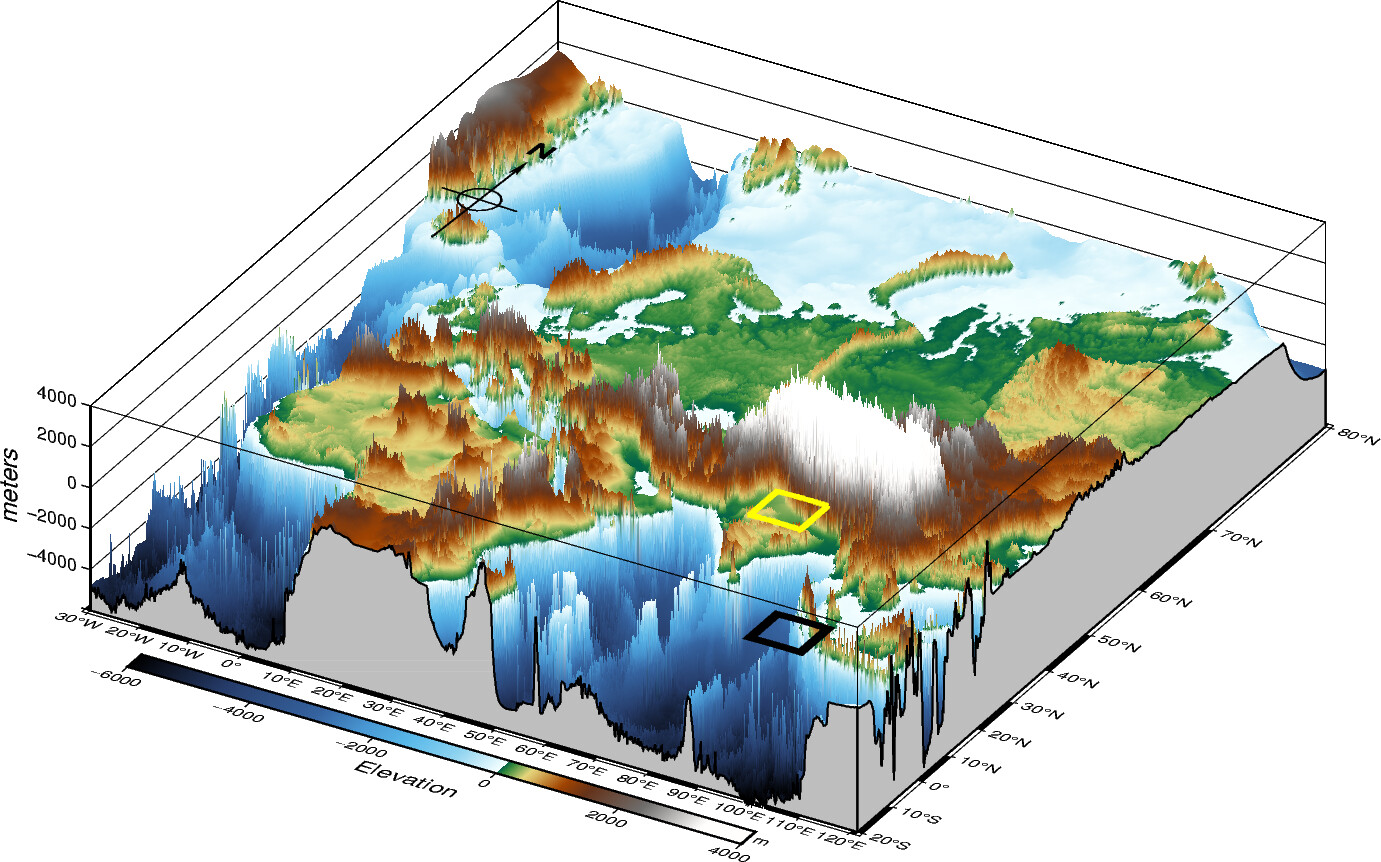
I am new to PyGMT and trying to draw a rectangular box on a 3-D map . Although I have created the 3-d map successfully, I am unable to draw the rectangular box on the correct position (it is drawing the box on correct location only when the perspective is 180,90). I am attaching my code below:
import pygmt

minlon, maxlon = -30., 121.
minlat, maxlat = -20., 80.

# Load sample earth relief data
grid = pygmt.datasets.load_earth_relief(resolution="10m", region=[minlon, maxlon, minlat, maxlat])

frame =  ["xa1f0.25","ya1f0.25", "z2000+lmeters", "wSEnZ+b"]

pygmt.makecpt(
        cmap='geo',
        series=f'-6000/4000/100',
        continuous=True
    )
fig = pygmt.Figure()

fig.grdview(
    grid=grid,
    region=[minlon, maxlon, minlat, maxlat, -6000, 4000],
    perspective=[150, 30],
    frame=frame,
    projection="M15c",
    zsize="4c",
    surftype="i",
    plane="-6000+ggray",
    shading=0,
    # Set the contour pen thickness to "1p"
    contourpen="1p",
)

fig.plot(
    data=np.array([[72,27,82,35]]),
    style='r+s',
    pen="1p,black",
    perspective=True,
)

fig.basemap(
    perspective=True,
    rose="jTL+w3c+l+o-2c/-1c" #map directional rose at the top left corner
)

fig.colorbar(perspective=True, frame=["a2000", "x+l'Elevation in (m)'", "y+lm"])
fig.savefig("topo-plot_big_3d_box_nc.png", crop=True, dpi=300)
fig.show()
I think the problem is I am using fig.plot instead of fig.plot3d. However, I used fig.plot3d also but was unsuccessful. Any help would be highly appreciated!