How to get metadata and plot grid from xarray dataset

Hi - I’ve been using PyGMT to extract and plot seismic tomography models using some very simple algorithms. I’ve found code that work with PyGMT version 0.3.x no longer works with version 0.4.1

I get an error message from pygmt.grdinfo , where the grid metadata is not returned.
I suspect there is something very simple to do with the xarray dataset. Any help would be appreciated

HEre is my code with some lines commented to illustrate behaviors:

# read_plot_wang_et_al_2020_model.py

import xarray as xr
import pygmt

pygmt.show_versions()

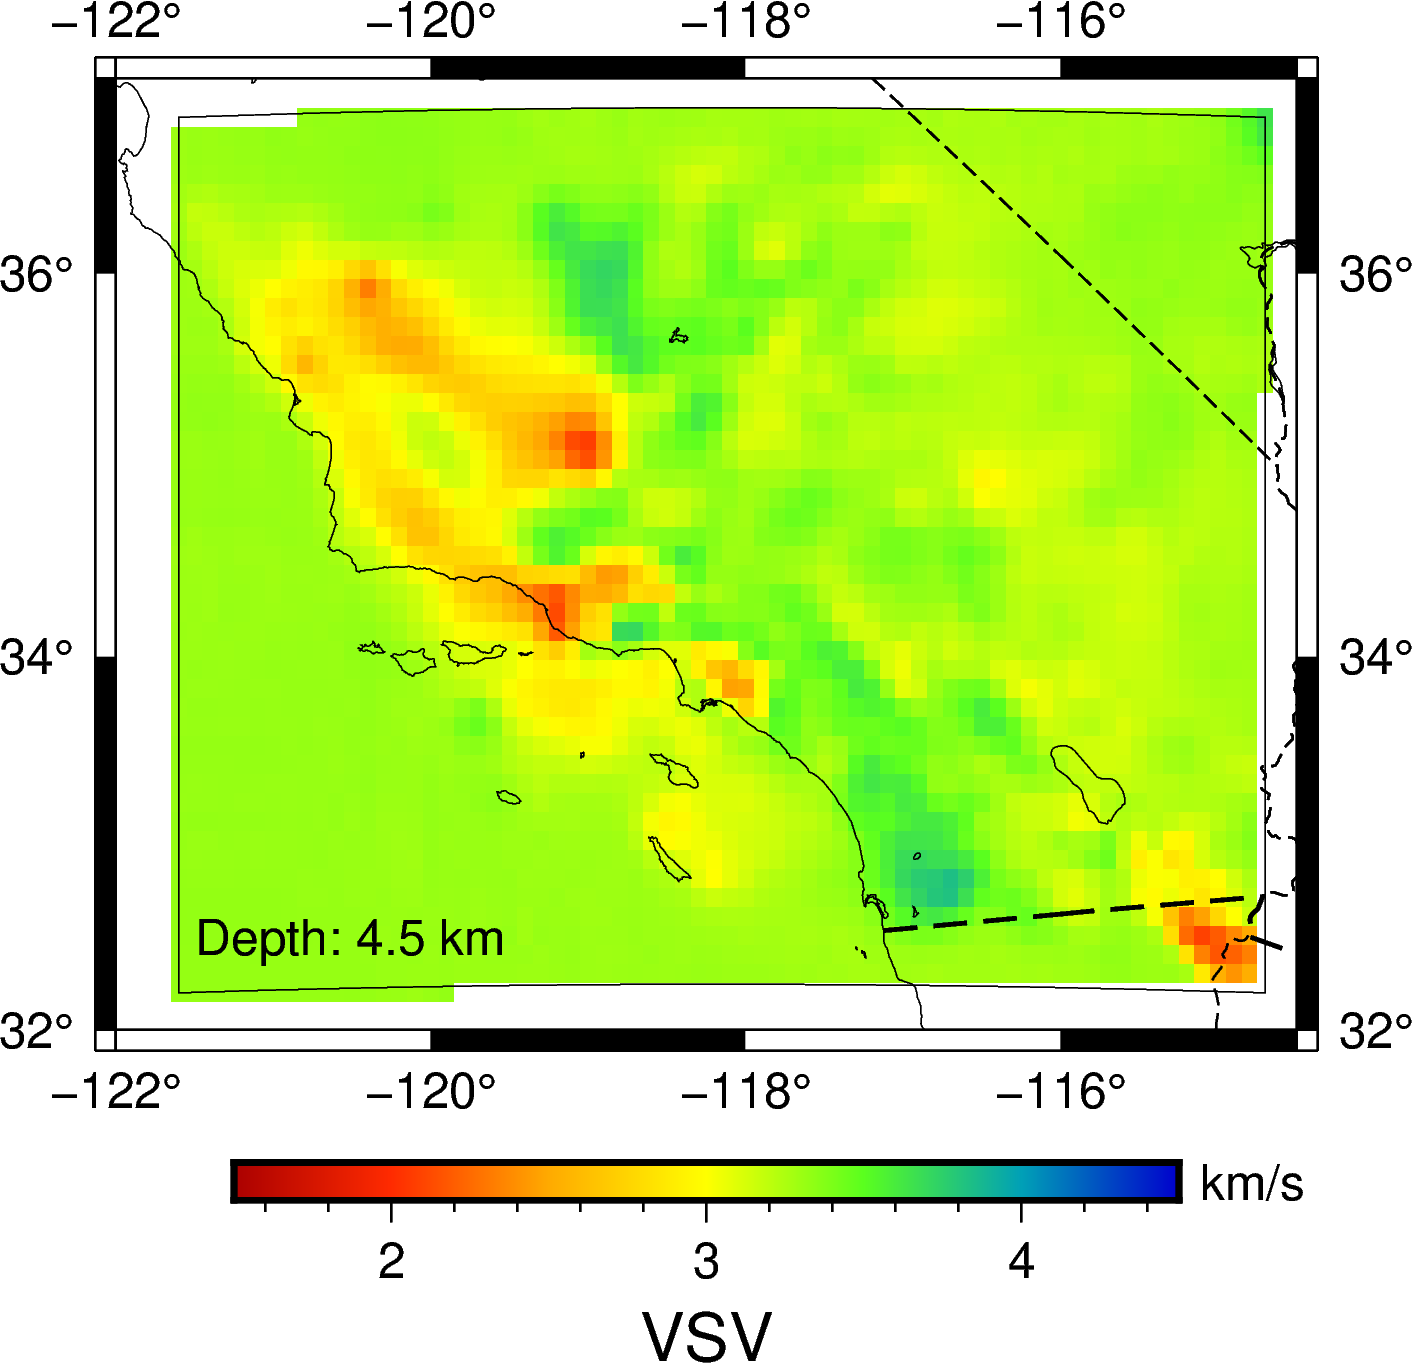
# Wang et al (2020) seismic tomography model of Southern CA, available at
# http://ds.iris.edu/ds/products/emc-socalanat_vsrawang2020/
filename = "SoCal.ANAT-Vs+RA.Wang.2020.nc"

ds = xr.load_dataset(filename)
vsv = ds.vsv.isel(depth=25)

# Plot 2D section for the 25th depth level with xarray, works fine
vsv.plot()

# pygmt cannot get the grid file metadata
pygmt.grdinfo(vsv)

# Get the domain limits from the dataset
ds_domain = [ 
    [ ds.longitude.values.min(), ds.longitude.values.min(), ds.longitude.values.max(), ds.longitude.values.max(), ds.longitude.values.min() ],    
    [ ds.latitude.values.min(), ds.latitude.values.max(), ds.latitude.values.max(), ds.latitude.values.min(), ds.latitude.values.min() ]
]

ds_domain

# Make map with PyGMT
fig = pygmt.Figure()

region_m = [ -122.0, -114.5, 32.0, 37.0 ]

fig.coast(
    region=region_m,
    projection="M6c",
    land="grey",
    water="lightblue",
    shorelines=True,
    frame="a",
)

pygmt.makecpt(cmap="seis", series="2.0/4.5/0.5", continuous=True, output="vs.cpt")

# PyGMT cannot get grid metadata
#fig.grdimage(grid=vsv, cmap="vs.cpt", nan_transparent=True)
#fig.grdimage(grid=vsv)

fig.plot(ds_domain[0], ds_domain[1])

fig.colorbar(cmap="vs.cpt", frame=["x+lVSV", "y+lkm/s"])

fig.show()
1 Like

Hi @rodgers7, thanks for trying out PyGMT! To help you troubleshoot this better, could you please provide the output of:

  1. print(vsv), so that we know what the contents of the data are
  2. The error message you get from pygmt.grdinfo(vsv)
  3. The output of pygmt.show_versions(), just to check the dependency versions you have installed.

Thanks!

Hi @weiji14 - HEre are answers to your message:

  1. print(vsv)
<xarray.DataArray 'vpv' (latitude: 47, longitude: 70)>
array([[6.22775, 6.23215, 6.22737, ...,     nan,     nan,     nan],
       [6.22999, 6.23055, 6.22781, ..., 6.20695, 6.20583,     nan],
       [6.23436, 6.23081, 6.22728, ..., 6.19235, 6.17265,     nan],
       ...,
       [6.20116, 6.21389, 6.20587, ..., 6.19986, 6.18479, 6.19561],
       [6.20309, 6.21366, 6.20391, ..., 6.2099 , 6.20717, 6.21921],
       [    nan,     nan,     nan, ..., 6.22334, 6.21391, 6.24271]],
      dtype=float32)
Coordinates:
  * latitude   (latitude) float32 32.2 32.3 32.4 32.5 ... 36.5 36.6 36.7 36.8
  * longitude  (longitude) float32 -121.6 -121.5 -121.4 ... -114.9 -114.8 -114.7
    depth      float32 10.0
Attributes:
    long_name:     Vertically P Velocity
    display_name:  Pv Velocity (km/s)
    units:         km.s-1
  1. The error message you get from pygmt.grdinfo(vsv)
grdinfo [WARNING]: Detected a data cube (/Users/rodgers7/WORK/SALVUS_LDRD/ALT_MODELS/Kai_et_al_2020/SoCal.ANAT-Vs+RA.Wang.2020.nc) but -Q not set - skipping
Traceback (most recent call last):

  File "/var/folders/xp/mltmds7x0v7g81v7vzx127h80008_q/T/ipykernel_81007/2707875882.py", line 1, in <module>
    pygmt.grdinfo(vsv)

  File "/Users/rodgers7/anaconda3/envs/pygmt/lib/python3.9/site-packages/pygmt/helpers/decorators.py", line 582, in new_module
    return module_func(*args, **kwargs)

  File "/Users/rodgers7/anaconda3/envs/pygmt/lib/python3.9/site-packages/pygmt/helpers/decorators.py", line 725, in new_module
    return module_func(*args, **kwargs)

  File "/Users/rodgers7/anaconda3/envs/pygmt/lib/python3.9/site-packages/pygmt/src/grdinfo.py", line 116, in grdinfo
    with file_context as infile:

  File "/Users/rodgers7/anaconda3/envs/pygmt/lib/python3.9/contextlib.py", line 117, in __enter__
    return next(self.gen)

  File "/Users/rodgers7/anaconda3/envs/pygmt/lib/python3.9/site-packages/pygmt/clib/session.py", line 1337, in virtualfile_from_grid
    _gtype = {0: "GMT_GRID_IS_CARTESIAN", 1: "GMT_GRID_IS_GEO"}[grid.gmt.gtype]

  File "/Users/rodgers7/anaconda3/envs/pygmt/lib/python3.9/site-packages/xarray/core/extensions.py", line 36, in __get__
    accessor_obj = self._accessor(obj)

  File "/Users/rodgers7/anaconda3/envs/pygmt/lib/python3.9/site-packages/pygmt/accessors.py", line 34, in __init__
    self._registration, self._gtype = map(

ValueError: not enough values to unpack (expected 2, got 0)
  1. output of pygmt.show_versions()
PyGMT information:
  version: v0.4.1
System information:
  python: 3.9.6 | packaged by conda-forge | (default, Jul 11 2021, 03:36:15)  [Clang 11.1.0 ]
  executable: /Users/rodgers7/anaconda3/envs/pygmt/bin/python
  machine: macOS-10.15.7-x86_64-i386-64bit
Dependency information:
  numpy: 1.21.2
  pandas: 1.3.2
  xarray: 0.19.0
  netCDF4: 1.5.7
  packaging: 21.0
  ghostscript: 9.54.0
  gmt: 6.2.0
GMT library information:
  binary dir: /Users/rodgers7/anaconda3/envs/pygmt/bin
  cores: 12
  grid layout: rows
  library path: /Users/rodgers7/anaconda3/envs/pygmt/lib/libgmt.dylib
  padding: 2
  plugin dir: /Users/rodgers7/anaconda3/envs/pygmt/lib/gmt/plugins
  share dir: /Users/rodgers7/anaconda3/envs/pygmt/share/gmt
  version: 6.2.0

Thanks!

Ah, I see what went wrong now. This is the GMTDataArrayAccessor acting up I think. So you’ll need to unlink the xarray.DataArray from its original netCDF source, e.g. try something like this:

vsv.encoding["source"] = None
pygmt.grdinfo(vsv)

The reason is that the dictionary vsv.encoding has a pointer to your netCDF source file (SoCal.ANAT-Vs+RA.Wang.2020.nc) which is retained even though you only took a slice of the dataset using vsv.isel(). PyGMT is trying to read from that NetCDF source, but since the NetCDF is a 3D data cube, it throws up an error.

The essence of this problem has been reported in https://github.com/GenericMappingTools/pygmt/issues/524, so we’re aware of it, but haven’t found a good long term solution yet :sweat_smile:

Tried your suggestion, but pygmt throws an error message, while xarray can plot the dataarray. Also, I cannot inquire what the registration is. It’s not clear why I could plot these without any problems with a previous version, but now pygmt has an error. I’ll try to follow threads on this or other work arounds

Here is what I tried and the error message:

filename = "SoCal.ANAT-Vs+RA.Wang.2020.nc"
     
ds = xr.load_dataset(filename)
vsv = ds.vsv.isel(depth=25)
vsv.plot()
vsv.encoding["source"] = None
pygmt.grdinfo(vsv)

Error message now is:

File "/Users/rodgers7/WORK/SALVUS_LDRD/ALT_MODELS/Kai_et_al_2020/read_plot_wang_et_al_2020_model.py", line 17, in <module>
    pygmt.grdinfo(vsv)

  File "/Users/rodgers7/anaconda3/envs/pygmt/lib/python3.9/site-packages/pygmt/helpers/decorators.py", line 582, in new_module
    return module_func(*args, **kwargs)

  File "/Users/rodgers7/anaconda3/envs/pygmt/lib/python3.9/site-packages/pygmt/helpers/decorators.py", line 725, in new_module
    return module_func(*args, **kwargs)

  File "/Users/rodgers7/anaconda3/envs/pygmt/lib/python3.9/site-packages/pygmt/src/grdinfo.py", line 116, in grdinfo
    with file_context as infile:

  File "/Users/rodgers7/anaconda3/envs/pygmt/lib/python3.9/contextlib.py", line 117, in __enter__
    return next(self.gen)

  File "/Users/rodgers7/anaconda3/envs/pygmt/lib/python3.9/site-packages/pygmt/clib/session.py", line 1337, in virtualfile_from_grid
    _gtype = {0: "GMT_GRID_IS_CARTESIAN", 1: "GMT_GRID_IS_GEO"}[grid.gmt.gtype]

  File "/Users/rodgers7/anaconda3/envs/pygmt/lib/python3.9/site-packages/xarray/core/extensions.py", line 36, in __get__
    accessor_obj = self._accessor(obj)

  File "/Users/rodgers7/anaconda3/envs/pygmt/lib/python3.9/site-packages/pygmt/accessors.py", line 35, in __init__
    int, grdinfo(self._source, per_column="n", o="10,11").split()

  File "/Users/rodgers7/anaconda3/envs/pygmt/lib/python3.9/site-packages/pygmt/helpers/decorators.py", line 582, in new_module
    return module_func(*args, **kwargs)

  File "/Users/rodgers7/anaconda3/envs/pygmt/lib/python3.9/site-packages/pygmt/helpers/decorators.py", line 725, in new_module
    return module_func(*args, **kwargs)

  File "/Users/rodgers7/anaconda3/envs/pygmt/lib/python3.9/site-packages/pygmt/src/grdinfo.py", line 115, in grdinfo
    file_context = lib.virtualfile_from_data(check_kind="raster", data=grid)

  File "/Users/rodgers7/anaconda3/envs/pygmt/lib/python3.9/site-packages/pygmt/clib/session.py", line 1417, in virtualfile_from_data
    kind = data_kind(data, x, y, z)

  File "/Users/rodgers7/anaconda3/envs/pygmt/lib/python3.9/site-packages/pygmt/helpers/utils.py", line 63, in data_kind
    raise GMTInvalidInput("No input data provided.")

GMTInvalidInput: No input data provided.

Sorry, maybe try vsv.encoding.pop("source", None) instead?

Hi @weiji14 - The suggested fix help pyGMT to read the file. It turns out there was some corruption of the source NetCDF file. The longitude and latitudes were rounded, so pygmt.grdinfo complained about an uneven spacing. I was able to easily repair this and can now plot the model!

Thanks for your help!!
wang_socal|517x500

1 Like