Ladies and Gents,
I’m experimenting with some Copernicus Global Land Classes. They are provided as GeoTIFFs with each shade of grey being a discrete class. I made a custom categorical CPT for it to shade each class differently.
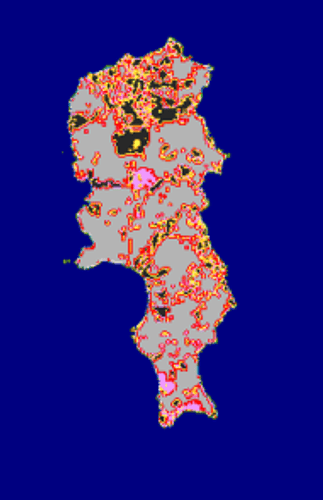
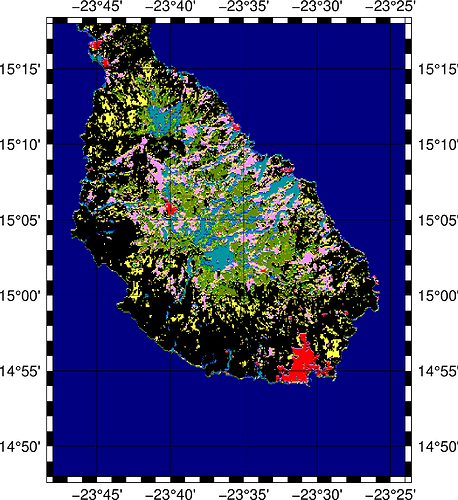
The result of the plot is not what I expected. I get color fringing around different areas where I expected crisp changes in land class.
How do I correctly color these areas in? Where am I making a mistake?
Commands used:
gmt grdconvert W040N20_PROBAV_LC100_global_v3.0.1_2019-nrt_Discrete-Classification-map_EPSG-4326.tif.tiff -Gcv_discclass.grd
gmt grdimage -JM20cm cv_discclass.grd -Ccopernicus -pdf caboverde2
This is my custom CPT:
#
# Color table for Copernicus Land Class
#
#------------------------------------------------
# COLOR_MODEL = RGB
#------------------------------------------------
0 40/40/40
20 255/187/34
30 255/255/76
40 240/150/255
50 250/0/0
60 180/180/180
70 240/240/240
80 0/50/200
90 0/150/160
100 250/230/160
111 88/72/31
113 112/102/62
112 0/153/0
114 0/204/0
115 78/117/31
116 0/120/0
121 102/96/0
122 141/180/0
123 141/116/0
124 160/220/0
125 146/153/0
126 100/140/0
200 0/0/128
#------------------------------------------------
B black
F white
N gray
#------------------------------------------------
Data:
cv_discclass.grd.zip (377.2 KB)

