Hi,
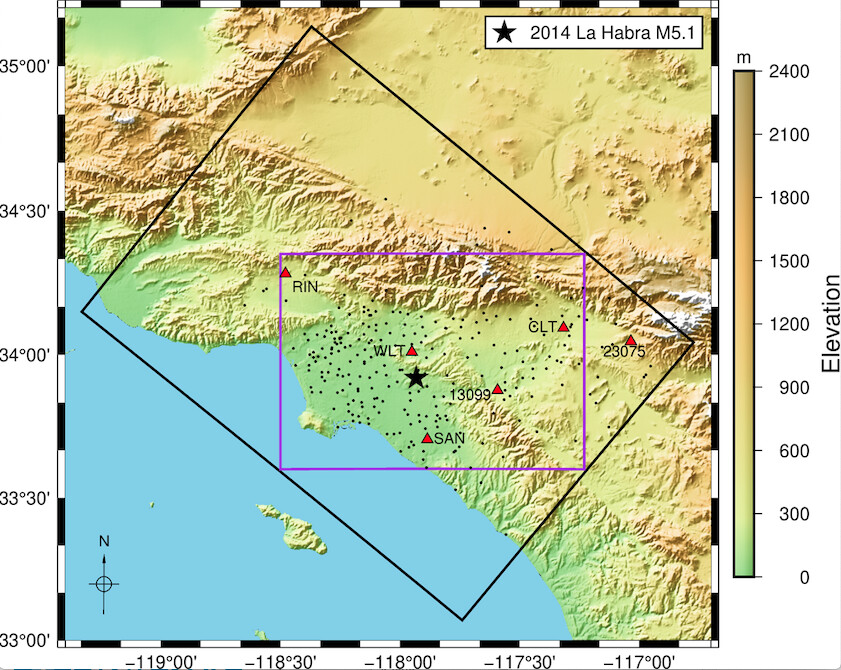
I would like to plot a 2D array on top of the topography within the black box shown in the figure below.
I have a few questions on making the plot:
(1) The region is rotated, and thus using “JC” projection doesn’t work for me (at least I don’t know how to make it…)
(2) Is there a way to map the 2D array to geographical coordinate GMT file (e.g. NetCDF)?
(3) If not, I can use float-number Cartesian coordinate system (Jx?), but I always got errors like:
grdimage [ERROR]: Internal Failure = GMT_MAP_EXCEEDS_360
grdimage (GMT_grdimage): Map region exceeds 360 degrees
range=-119.4/-116.7/33/35.2

gmt begin topography_large_gmt2 png
gmt basemap -JM15c -R${range} -Baf -BSWen
gmt makecpt -Czambezi -T0/2400
gmt grdsample @earth_relief_15s -R${range} -Ginterp.grd -I32e/32e
gmt grdimage interp.grd -I
gmt colorbar -DjMR+o-1c/0+m -I0.3 -Bxa300+lElevation -By+lm
gmt coast -JM15c -Sskyblue # -W1/1p
gmt plot -Sa0.6c -Gblack -l"2014 La Habra M5.1"<< EOF
-117.932587 33.918633
EOF

gmt plot -W1.5p,black -L << EOF
-119.3309098848646 34.149236516966624
-117.7401908038864 33.06957796456456
-116.77297541421393 34.04292416669585
-118.3704310693418 35.13480950243679
EOF

gmt end
A baseline script is shown above (sorry the 2D array is too large to include; I guess gmtmath can make a random 2d array, but I don’t know how to do it), and I appreciate any help from you!
P.S. GMT works nicely to plotting things from my very limited experience, but to be honest I always feel it hard to solve problems on our own. The modern mode helps a lot, and I hope more people can upload their scripts and output plots for future users to learn!