Hi @pan3rock,
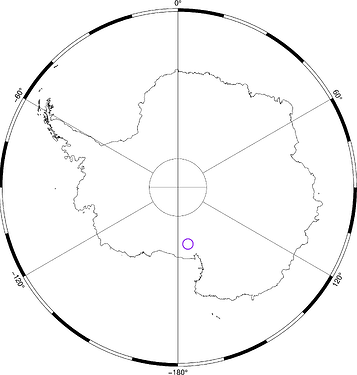
Great to see another Antarctic scientist  . You’re actually just missing a dash ‘-’ in the command (should be
 style="E-"), and probably need to set a pen too. Try this:
import pygmt

region = [-180, 180, -90, -60]
projection = "s0/-90/-71/1:33000000"
fig = pygmt.Figure()
fig.coast(
    region=region, projection=projection, frame="afg", resolution="i", shorelines="0.3p"
)
fig.plot(x=[170], y=[-80], sizes=[200], style="E-", pen="1.5p,purple2")
fig.show()
produces:
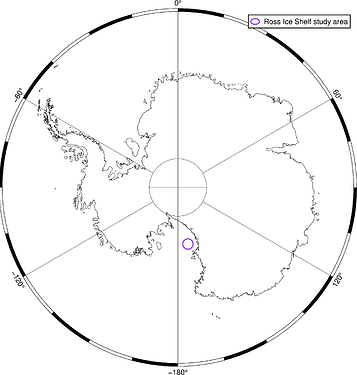
By the way, you can also plot the grounding line using area_thresh="+ag" (see coast’s -A option), and label you study area like so:
import pygmt

region = [-180, 180, -90, -60]
projection = "s0/-90/-71/1:33000000"
fig = pygmt.Figure()
fig.coast(
    region=region,
    projection=projection,
    area_thresh="+ag",
    frame="afg",
    resolution="i",
    shorelines="0.3p",
)
fig.plot(
    x=[170],
    y=[-80],
    sizes=[200],
    style="E-",
    pen="1.5p,purple2",
    label='"Ross Ice Shelf study area"',
)
fig.legend()
fig.show()
produces:
Let me know if that helps. There doesn’t seem to be a way to simultaneously plot both the ice shelf ‘coastline’ and grounding line (using -Aig) but we could raise that as a feature request 

