Hi everyone,
I am struggling with the cross-section plot of earthquakes along with the FMS.
Here is my script:
May someone suggest me how can I fix this.
Thank you!
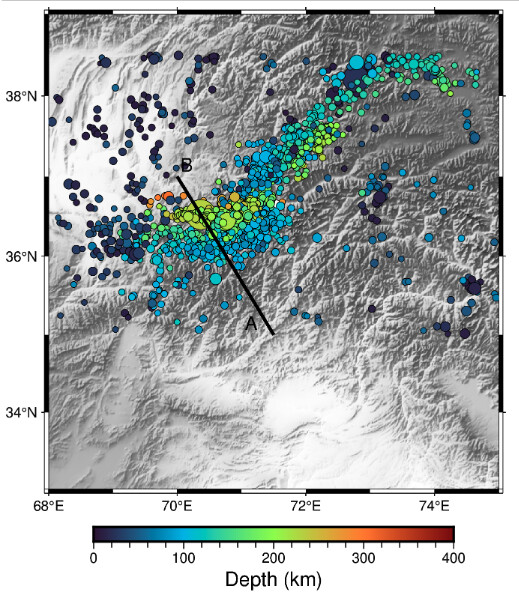
Data and expected results are attached here.
import pygmt
import numpy as np
import pandas as pd
names = ["lat", "long", "depth", "Mag"]
df = pd.read_txt('USGS.txt',sep=',',names=names)
lons = df['long']
lats = df['lat']
mag=df['Mag']
dep=df['depth']

minlon, maxlon = 68, 75
minlat, maxlat = 33, 39
region=[minlon, maxlon, minlat, maxlat]
grid = pygmt.datasets.load_earth_relief(resolution="30s", region=region)
fig = pygmt.Figure()
fig.grdimage(grid=grid,region=region,projection='M4i',shading=True,frame=True, cmap="grayC")
pygmt.makecpt(cmap="turbo", series='0/400/100',continuous=True)
#fig.coast(shorelines=True,frame=True, map_scale='jBL+w100k+o0.6c/0.6c+f')
fig.plot(x=lons, y=lats, size=0.02*(1.6**mag), style="cc", color= dep, pen="black", cmap=True)
fig.colorbar(frame='+l"Depth (km)"')
fig.plot(x=[71.5, 70], y=[35, 37], projection="M", pen=2)
fig.text(x=71.15, y=35.15, text="A", font="12,Helvetica")
fig.text(x=70.15, y=37.15, text="B", font="12,Helvetica")

#pygmt.project(output="cross.dat", x=lons,y=lats,z=dep,center="71.5/35",endpoint="70/37",width="-100/100")

fig.show()
I am looking for a similar result along with the FMS.

Three cross-section lines with three subplots in lower panel.
Data is also attached here:
Thank you!
Potassic.txt (26.4 KB)
