I am a geologist and I collected structural data with my students on the field last September.
We used a GNSS device to locate our data points using UTM WGS-84 system. I used WGS-84 instead of Lat/Long for allowing the students to relocate the data points on paper maps with UTM WGS84 grid.
I would like to teach them how to plot their data with GMT – I know how to do it with lat/long data but I don’t know how to do it with WGS84 data.
Could you please help me to produce a map with a UTM WGS-84 grid – kilomeric grid as shown on paper map – and how to plot my GNSS points ?
The region we have been working on is between 31T and 32T.
Just a clarification first. WGS84 is a Datum (ellipsoid + reference), not a coordinate system. Your lon, lat coordinates are very likely referenced to WGS84.
But to the point. I didn’t get if your GPS stations made the conversion to UTM directly, or if you have the coordinates in geographics and and to plot them in UTM. In later case you must convert them to UTM using mapproject and next just make a linear map (-JX) with the locations.
Thank you very much for your help and your quick answers.
This is the kind of data I have with my device : 31T 0712579
5285428
The data are directly given in UTM (WGS84).
I had a look on example 28 but it did not solve my problem – I would like to plot the data points on a map with a UTM grid. The data are included in two zones 31T and 32T and I don’t know how to set basemap in this case.
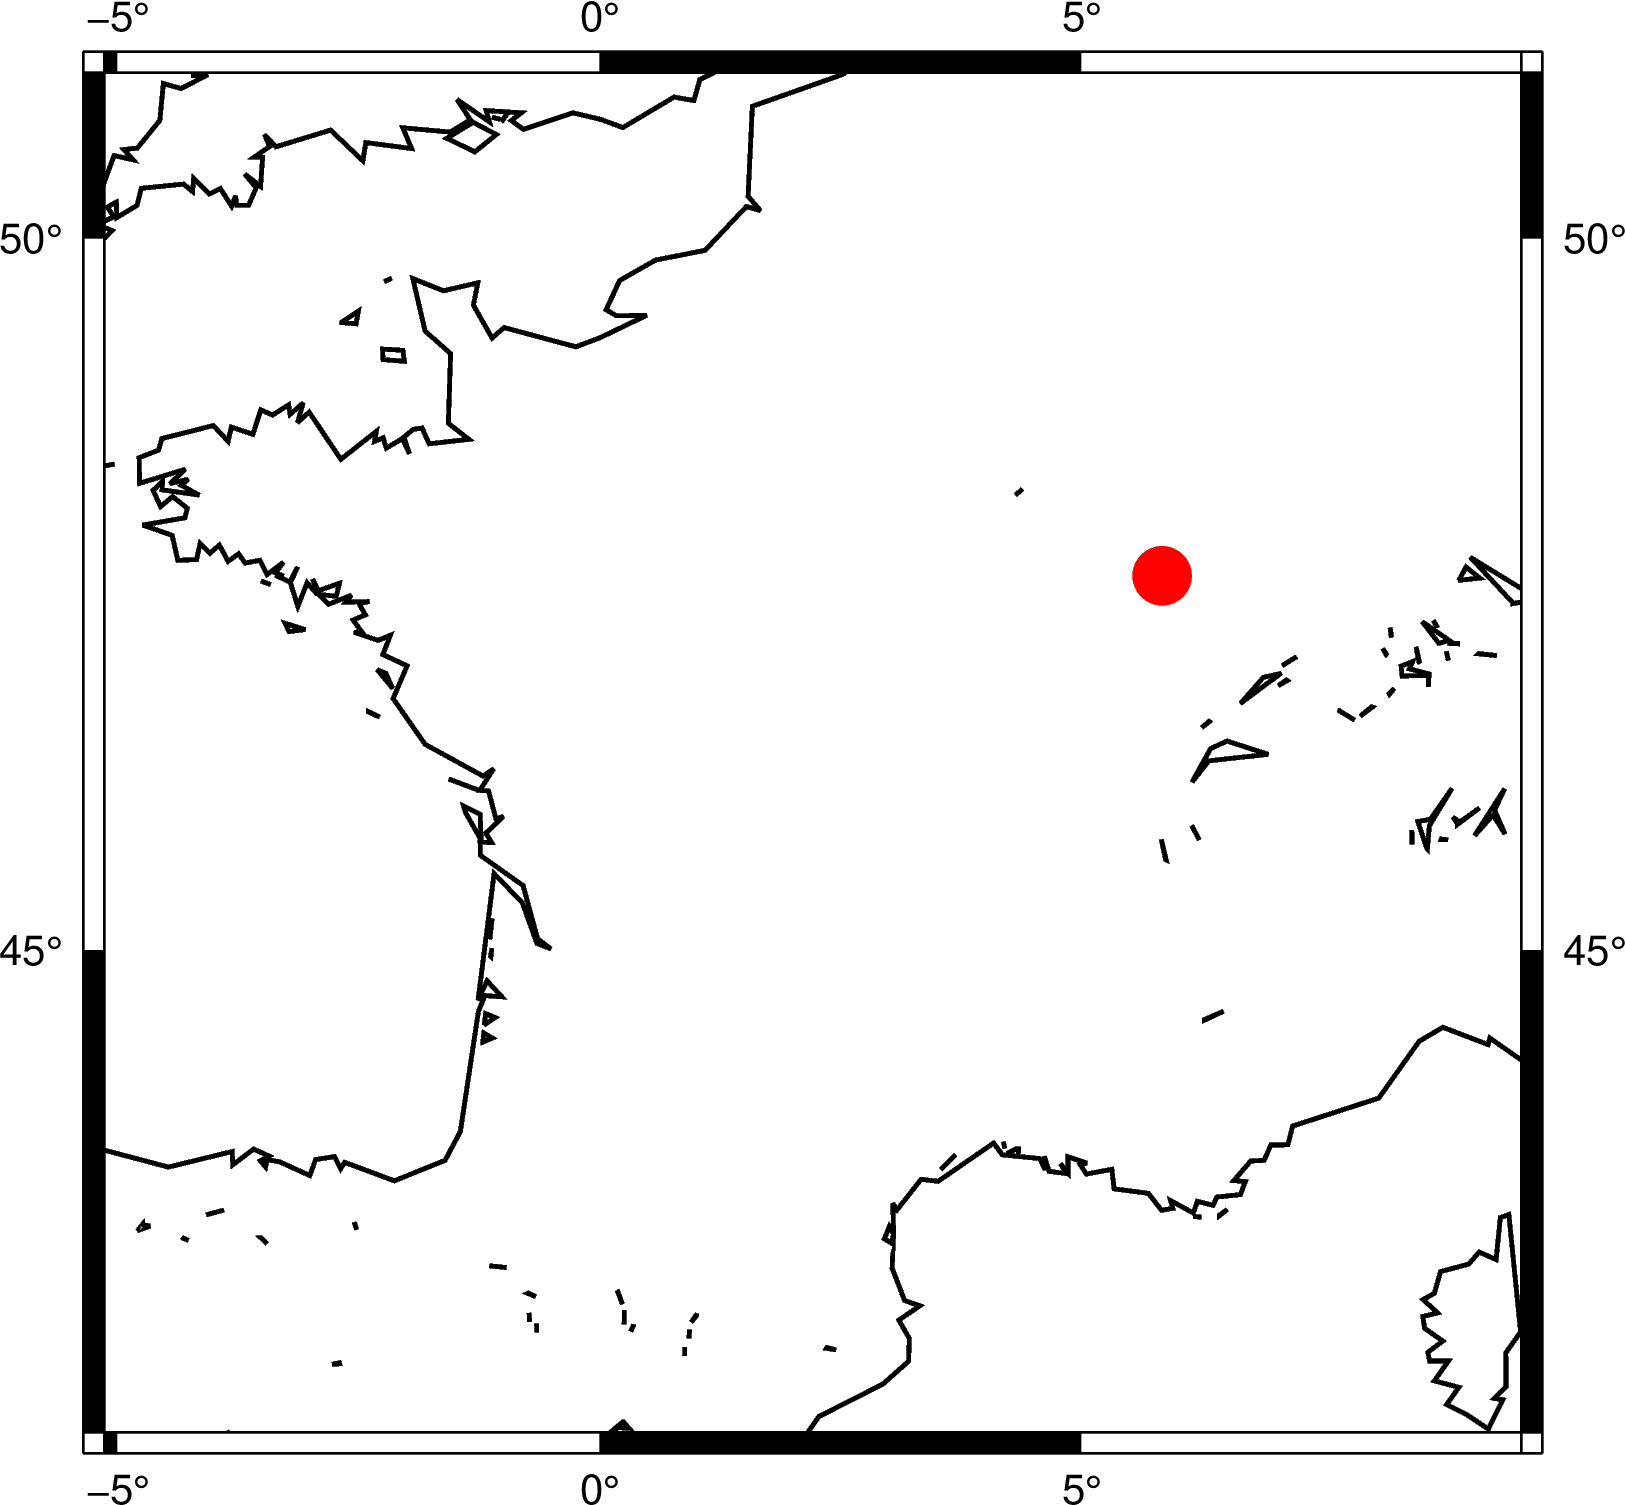
Could you please tell me how you would set basemap, coast and psxy in GMT for plotting these two points :
31T 0726090 32N 0284021
5231224 5239514
Thank you very much Joaquim, this will do the job.
So if I want now to plot in zone 32T, I just have to write gmt mapproject -Ju32T/1:1 ?
I am agree with you that working with lat/long data with gmt is much more convenient than UTM. However, I have been taught when I was student to only use UTM (WGS84) with my gps device with. I was therefore slightly surprised to see that it is not straightforward to use UTM projection.
If now I want to make a map with UTM coordinate including the two zones 31T and 32T instead of lat° and long°. Is it possible with GMT ? How would you do it ? or is it simply better to stick with lat/long coordinate ?
?
GPS measure their coordinates in the ECEF (Earth Centered Earth Fixed) reference. That is with respect to Earth center of mass. That is natural since satellites orbit around that point.
With the help of a ellipsoid (part of the WSG84 system) and a Geoid one can get the z coordinate but lon,lat are obtained by geometry. UTM (and all other cartographic) projection is just that, a projection and as such it implies deformations. So, no, UTM is not the best referencing system when working with GPS data. But it can be good enough.
No, you can’t. Neither in GMT nor in any other software. Each zone (or graticule as is your case) is a different referencing system.
You have to convert your points into a common referencing system. Lon,lat, Transverse Mercator, Lambert (which the French like very much), etc… and then plot them.