How to plot fault geometry with fault slip rate in GMT?

Hi all,
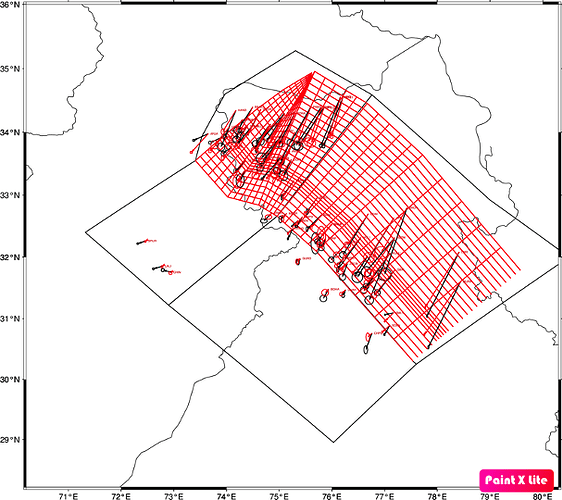
Recently I tried to plot fault geometry along with slip rate using GMT but it is not plotted. I am unable to understand where is the error. Please help.

This is the script I am using:

!/usr/bin/env sh
gmt begin fault_grid.png
gmt basemap -R70.2/80.3/28.2/36 -JM10i -Ba2f2

gmt makecpt -Cjet.cpt -G0.4/1 -Ic -T0/22 > fault.cpt
gmt coast -R70.2/80.3/28.2/36 -JM10i -B5 -I1/1p,blue -N1/0.25p,black -W0.25p,white -Gyellow -Sblue

gmt plot fault.txt -R70.2/80.3/28.2/36 -JM10i -W0.1p -L -Cfault.cpt
gmt coast -R70.2/80.2/28.2/36 -JM10i -Bx4 -By2 -Da -W229/195/148

awk '{ if ($5==1 && $6==1) print $8, $9, $12, $17, $15, $20, $27, $1 }' jks0.vsum | gmt velo -R70.2/80.3/28.2/36 -JM10i -Se0.2/0.32/4 -W1p,black -L0.8p,black -A5p+e -Gblack

#gmt psconvert $ps -A -Tg
#rm $ps gmt.* $cpt

gmt end show

File format of fault.txt

> -Z 14.398  (Fault slip)
74.96000000 32.66000000 (Lon1,Lat1)
74.89000000 32.69600000  (Lon2,Lat2)
74.91838328 32.73829841  .......
74.99014893 32.70155361
> -Z 14.290
74.99014893 32.70155361
74.91838328 32.73829841
74.94676657 32.78059681
75.02029785 32.74310723
> -Z 14.185
75.02029785 32.74310723
74.94676657 32.78059681
74.97514985 32.82289522
75.05044678 32.78466084
> -Z 14.084
75.05044678 32.78466084
74.97514985 32.82289522
75.00353313 32.86519362
75.08059570 32.82621445
> -Z 13.985
75.08059570 32.82621445
75.00353313 32.86519362
75.03191642 32.90749203
75.11074463 32.86776807
> -Z 13.891
75.11074463 32.86776807
75.03191642 32.90749203
75.06029970 32.94979044
75.14089356 32.90932168
> -Z 13.799
75.14089356 32.90932168
75.06029970 32.94979044
75.08868298 32.99208884
75.17104248 32.95087529

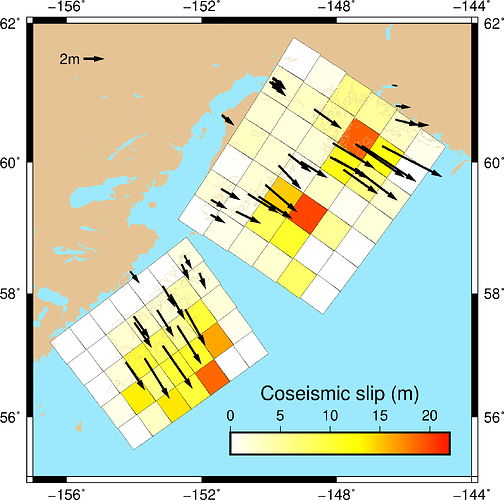
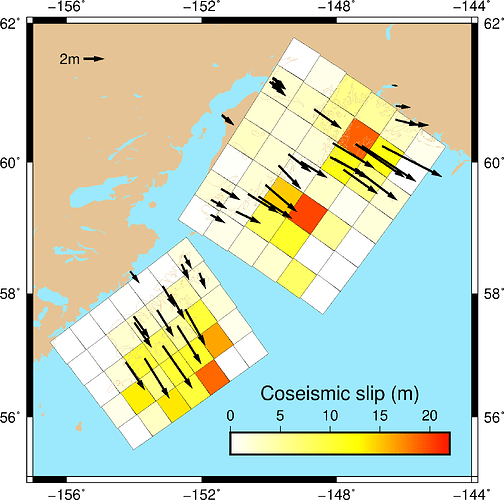
The plot should somewhat should look like this which I am not getting.
Hi Adi

What is the desire result that would you like achieve?

7966c8d86770e35e38ed5a883ef12c33f5bd7475_2_504x500
This has to be the result. I have to plot fault slip magnitude along the fault geometry as shown in this image .

Its not taking the color variation given in cpt

Sorry, I didn’t read well. And what is map that you are gettiing?

Is it only the color that is not working ?
Try makecpt [...] -H > ...


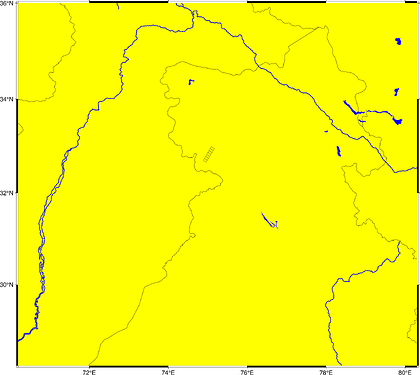
Whatever cpt I am giving its plotting the outline.No colour variation.
its also not giving different colour to land and sea in “pscoast”

I managed to get this figure with the following script

#! /usr/bin/env sh

gmt begin fault_grid png
 gmt basemap -R70.2/80.3/28.2/36 -JM10i -Ba2f2
 gmt makecpt -Cjet -G0.4/1 -Ic -T0/22 -H > fault.cpt
 gmt coast -I1/1p,blue -N1/0.25p,black -W0.25p,white -Gyellow -Sblue
 gmt plot fault.txt -W0.1p -L -Cfault.cpt
 gmt coast -Da -W229/195/148
 #awk '{ if ($5==1 && $6==1) print $8, $9, $12, $17, $15, $20, $27, $1 }' jks0.vsum | gmt velo -R70.2/80.3/28.2/36 - Se0.2/0.32/4 -W1p,black -L0.8p,black -A5p+e -Gblack

gmt end

Yes its plotting the pscoast properly now but its not taking the cpt .

fault.txt (50.4 KB)
I have attached the fault.txt file which I am using to plot the fault slip magnitude using cpt (not working) . please have a look.

Ok, now I think I understand. You want the polygons to be painted with the value of the segment header.

Just remove the white space in the segment header between the -Z and the value (e.g.: -Z14.398).

fault.txt (50,0 KB)

1 Like

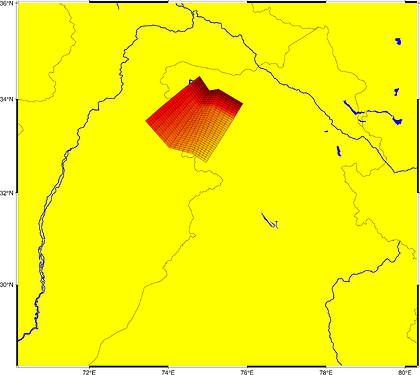
Yes its working now.Thanks alot @Esteban82 and @PlanetGus for the help !!
Can you please suggest how can i use gmt script to make such polygons with different cpts ?