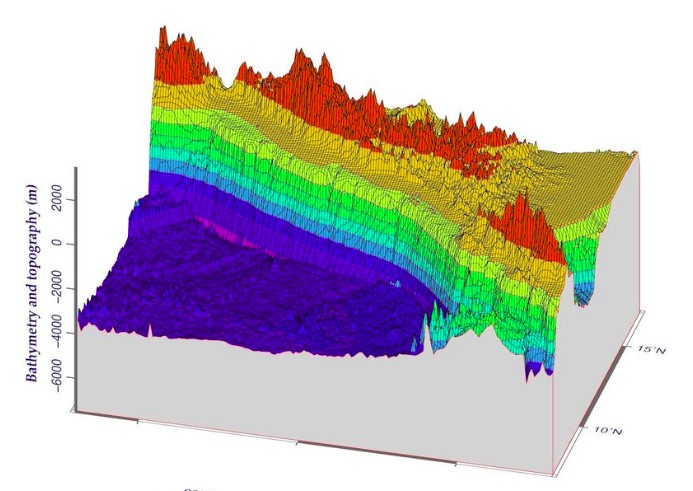
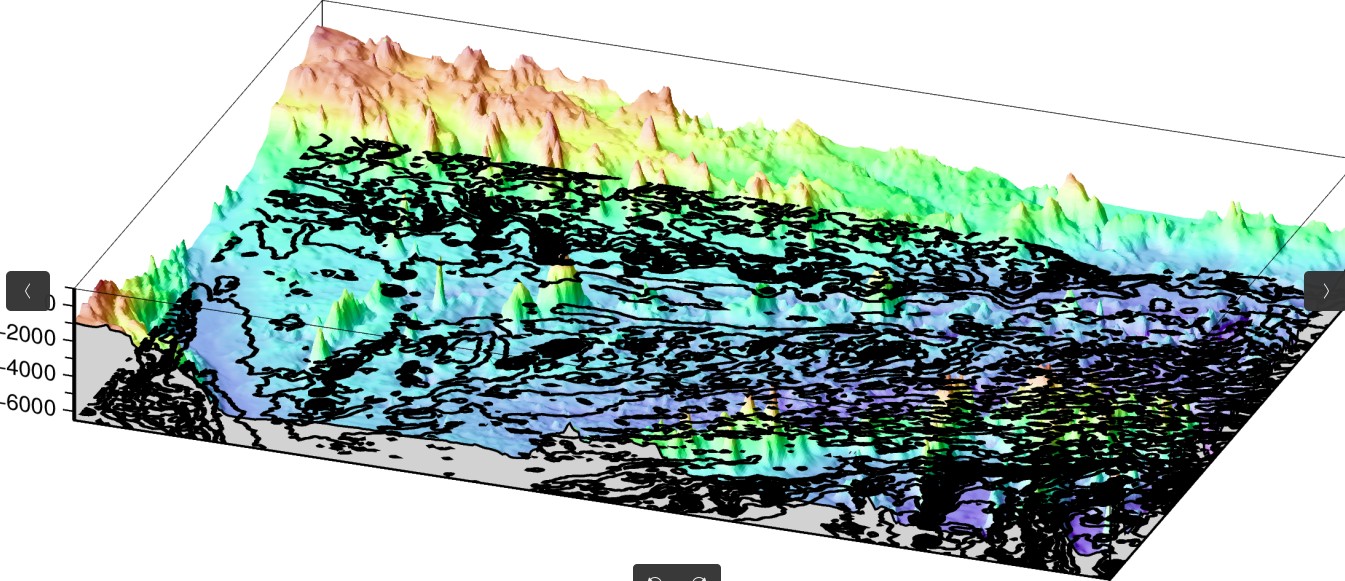
In plotted Figure (top) map shows surface plot while in (bottom) map both surface+mesh are plotted. But mesh addition hide the surface features in plot and display is not visible.
Query is that whether it is possible to get clear display of plot (may be by reducing density of mesh), so surface features become more visible in Figure.
Below is a reference figure, in which mesh is added but surface features are more visible.
I’m afraid that’s not possible (harder than it might seem on first though since it’s not just a decimation operation). The solution will have to be to resample the grid onto a coarser one and use it to do the mesh plot layer.
I think it means to sample area grid from main grid data using grdcut at coarser rate. Previously I used grdcut in the way (gmt grdcut @earth_relief_01m -R134/140/25/33 -Gexample_relief.grd). Can you explain how to to grid area at coarser rate, which parameter can do this task?
Using this way, contours are not appear in their correct positon on map. Do you have idea how to place contour to their correct position and then try your approach?