Hello,
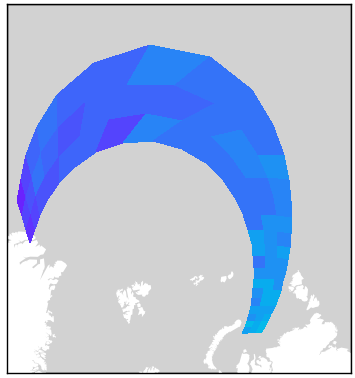
Is it possible to build a map based on the coordinates of the corners of a quadrilateral given in regular or non-regular grid
Like this plot

Thank you
Hello,
Is it possible to build a map based on the coordinates of the corners of a quadrilateral given in regular or non-regular grid
Like this plot

Thank you
You can use > style GMT polygons where > -Zvalue in the header can be interpreted by psxy with a -C option colorscale, and then flags to plot polygons as rectangles or great circle edges - check the psxy manual.
It’s involves converting a 2D grid into a redundant sequence of quadrilaterals.
I’m looking for a way to avoid this extra operation.
The grd files have all the necessary information.
You may see the analogue
If you have those on a grid, grdview will be able to generate such a gridded plot.
I read the theory (grdimage/grdview man pages), but all examples use the CF compliant grd files with 1d lat/lon datasets.
My corrected question is how to link 2d lat/lon datasets for irregular grid with plotted dataset
GMT does not support irregular grids. You will have to dump the lon, lat, z values and grid them first.
Is that an irregular grid? It looks more a grid that is regular in some (polar?) projection and became like that when the cell corners were converted to geographic.