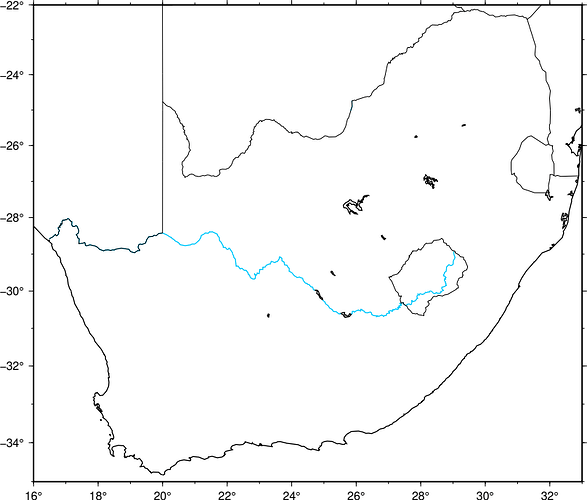
Good afternoon all, Please can someone help me out on how to plot sphdistance, I have be trying it for the past 4 days but not able to plot it. I need help on it, below is the code, table and the plot for your assistance
gmt begin map pdf
 gmt set MAP_FRAME_TYPE plain
 gmt set FONT_LABEL 16p
 gmt makecpt -Cjet -T-15/30/2
gmt pscoast -R16/33/-35/-22 -JM20c -BWSne -Baf -I1/1p,0/200/251 -W1,black -Gwhite -Di -N2/0.25p,black -Na/0.5,black  -Swhite > SA.ps
 gmt sphtriangulate sphdist.dat -Qv -D > t.txt
 gmt sphdistance -R16/33/-35/-22 -I1 -Q -Gsphdistance.nc -Lk
 gmt grdcontour sphdistance.nc -JM20c -C200 -A1000 -Bafg
gmt end show
| ##long | lat | Baselin | distance | trend (mm/yr) | strain rate (ns/yr) |
|---|---|---|---|---|---|
| 28.73 | -25.8 | brnk-kman | 585482.7849 | 0.529872 | 0.905017216 |
| 28.73 | -25.8 | brnk-krug | 101591.861 | 0.807424 | 7.947723293 |
| 28.73 | -25.8 | brnk-kstd | 253915.681 | -0.42579 | -1.676895252 |
| 26.51 | -33.32 | grhm-grnt | 219699.4559 | -0.963341603 | -4.384815607 |
| 26.51 | -33.32 | grhm-heid | 775992.9562 | -1.164514529 | -1.500676674 |
| 26.51 | -33.32 | grhm-hrac | 831168.1609 | -0.131461888 | -0.158165211 |
| 26.51 | -33.32 | grhm-ixop | 487358.5262 | -0.009527236 | -0.01954872 |
| 26.51 | -33.32 | grhm-kley | 532649.8163 | -0.087179301 | -0.163670949 |
| 26.51 | -33.32 | grhm-kman | 760152.5533 | -0.413122831 | -0.543473583 |
| 26.51 | -33.32 | grhm-krug | 811154.678 | -0.748993613 | -0.923367187 |
| 26.51 | -33.32 | grhm-kstd | 630845.0232 | 0.416425222 | 0.66010701 |
| 24.53 | -32.25 | grnt-heid | 736888.7823 | -2.013026227 | -2.731791114 |
| 24.53 | -32.25 | grnt-hrac | 768219.0729 | -0.977451076 | -1.272359813 |
| 24.53 | -32.25 | grnt-ixop | 576341.3867 | -1.151929874 | -1.998693657 |
| 24.53 | -32.25 | grnt-kley | 389345.7837 | -0.397910006 | -1.021996442 |
| 24.53 | -32.25 | grnt-kman | 513058.4321 | -0.328268625 | -0.639826977 |
| 24.53 | -32.25 | grnt-krug | 751818.3475 | -1.404661767 | -1.868352603 |
| 24.53 | -32.25 | grnt-kstd | 571143.9313 | -0.117879776 | -0.206392416 |
