Hi,
I have SATSI output file in the form of stress tensor.
COORDINATES ARE EAST,NORTH,UP.
stress tensors are:
X Y See Sen Seu Snn Snu Suu
where X and Y are the grid indices.
'See Sen Seu Snn Snu and Suu ’ are the stress tensor elements for that grid node
  0   1  0.854008  0.084013  0.056349 -1.190761  0.175654  0.336753
  0   3  0.823565 -0.089681 -0.026114 -1.233167  0.047261  0.409603
  0   4  0.781555 -0.132856 -0.054283 -1.268950  0.048804  0.487395
  1   0  0.868922  0.026651  0.054268 -1.155487  0.241943  0.286565
  1   1  0.936272  0.064530  0.062479 -1.129363  0.230122  0.193091
  1   2  0.910983 -0.018991  0.014692 -1.163135  0.149813  0.252153
  1   3  0.903053 -0.077182  0.000182 -1.177172  0.075788  0.274119
  1   4  0.854751 -0.071598 -0.120452 -1.192264 -0.007593  0.337513
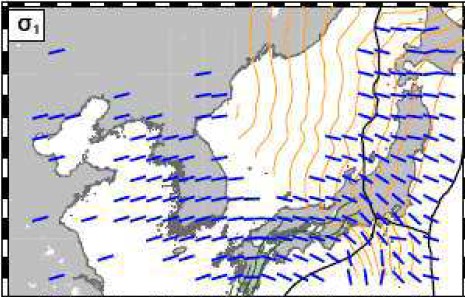
I need to plot it as a stress field with Shmax orientation. How can I plot that?