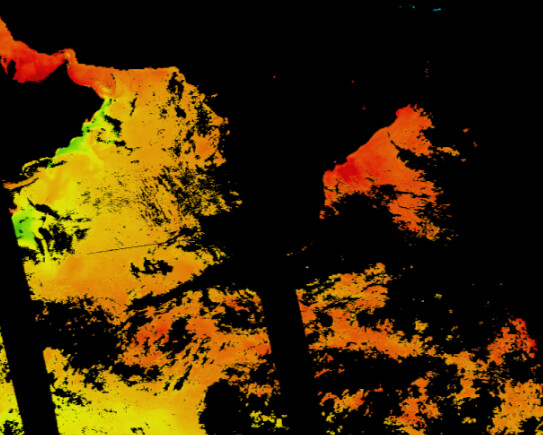
Hello!
I have SST file downloaded from NASA Ocean Color, size of
lat: 470 & lon: 409.
If I try to plot the data as points, I get the message that the dimensions don’t match, and if I try to plot using grdimage or grdcontour I get the following message:
“Grid appears to have irregular spacing in the ‘lon’ dimension.”
These are the values of coordinates:
How would I go about this issue, in order to get as close as possible to this?

Thank you! 
Your question is basically the same as Help reading coordinates in a NETCDF GMT6.1.1 … and as well my answer. But not python.
The error message implies that your longitude values are not equally spaced (i.e. it is an irregular grid). In your screenshot for example, 86.06917-86.027504=0.041666 is not equal to 86.027504-85.98584=0.041664. You will need to ensure that the longitude values are equally spaced before plotting in PyGMT/GMT.
One solution would be to use xarray’s interp function to interpolate your irregular grid onto a regular grid. You will need to specify the new coords (coordinate values), and the interp function will perform linear interpolation to convert your old grid into a new grid. The new grid can then be plotted with PyGMT/GMT.
1 Like
You will need to ensure that the longitude values are equally spaced before plotting in PyGMT/GMT.
Thanks! So there is no way to plot geophysical data unless its grid is equally spaced in the start? Not even contours or points? It doesn’t necessarily have to be a gridded plot.
Thanks for your reply! I’ll have to look further into it to make sense of the GMT languge. I’ll reply as soon as I attempt it and get results! 
Wait, your example image is showing a L3 type data. Level 3 products are gridded in a regular grid (I’ve processed hundreds of them) and can be used directly by GMT. Or am I wrong and they are not L3?
The picture is an example, but yes, it’s L3 mapped type data that I’m using. I’m currently working on figuring out how to use the binned type, as I will need to do further analysis.
Ah, the binned type. There was once a C code in the (OC) forum or around to read the binned type, which is not regular grid but instead with cells of constant area and therefore less columns per row as lat increases.
@weiji14, the interp works apperently nicely, I’m now able to plot the data onto coastlines. Of course, the “rawness” of the data is now a bit reduced, but it should be fine, though. I’ll test it for further validation.
Additional question, if I can find the “matching” projection of the satellite, should it theoretically be possible to directly plot the grid, without previous interpolation?
On a side note
fig.grdimage(
grid=ds)
is all that it required for grdimage to work, no need to activate interpolation nor dip. Just a tip for someone as new as me.
Thanks!

![]()

