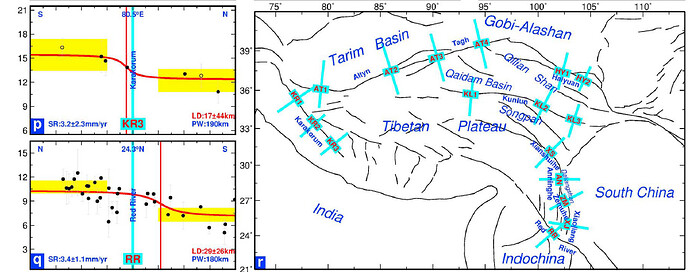
Hello, I’m a beginner of GMT. I have watched the tutorial videos of GMT6.0 online, but I still have no idea of how to make a picture such as this
The left part of this picture is the GPS velocity component (parallel or vertical to the section) within a certain wide alone the section in the right part.
I have tried to find a proper GMT Module but …
So, could anyone tell me how to draw a picture like this? Thanks a lot.
