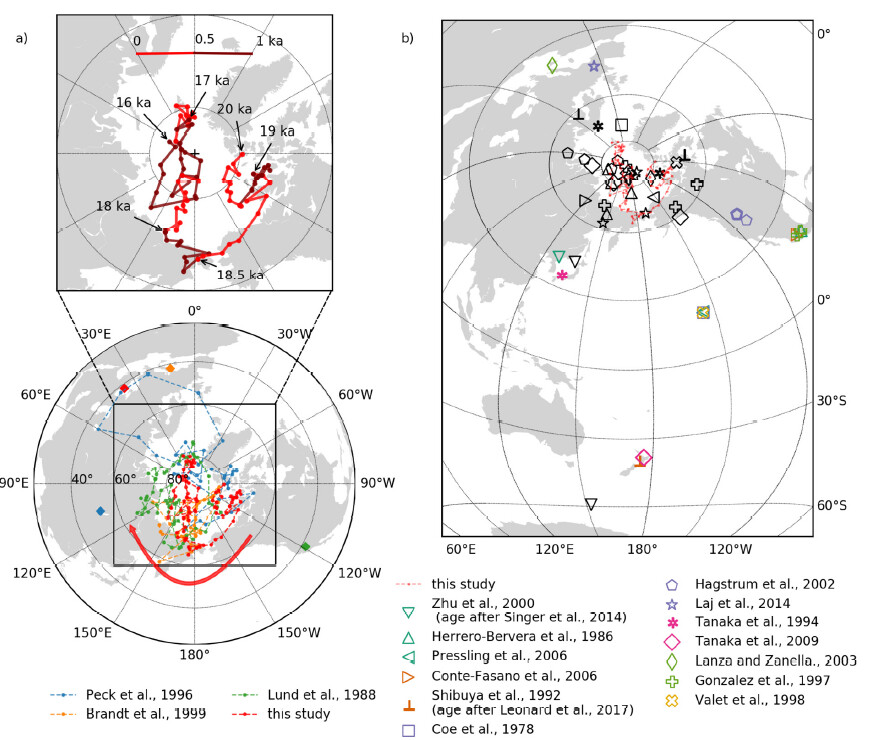
Thanks for the reply. Esteban82’s explanation is right, VGP data only have long. and lat. I want to plot scatters and lines as shown as the black line in the picture. A more picture of VGP. I want to know the projections in this picture, Thanks!