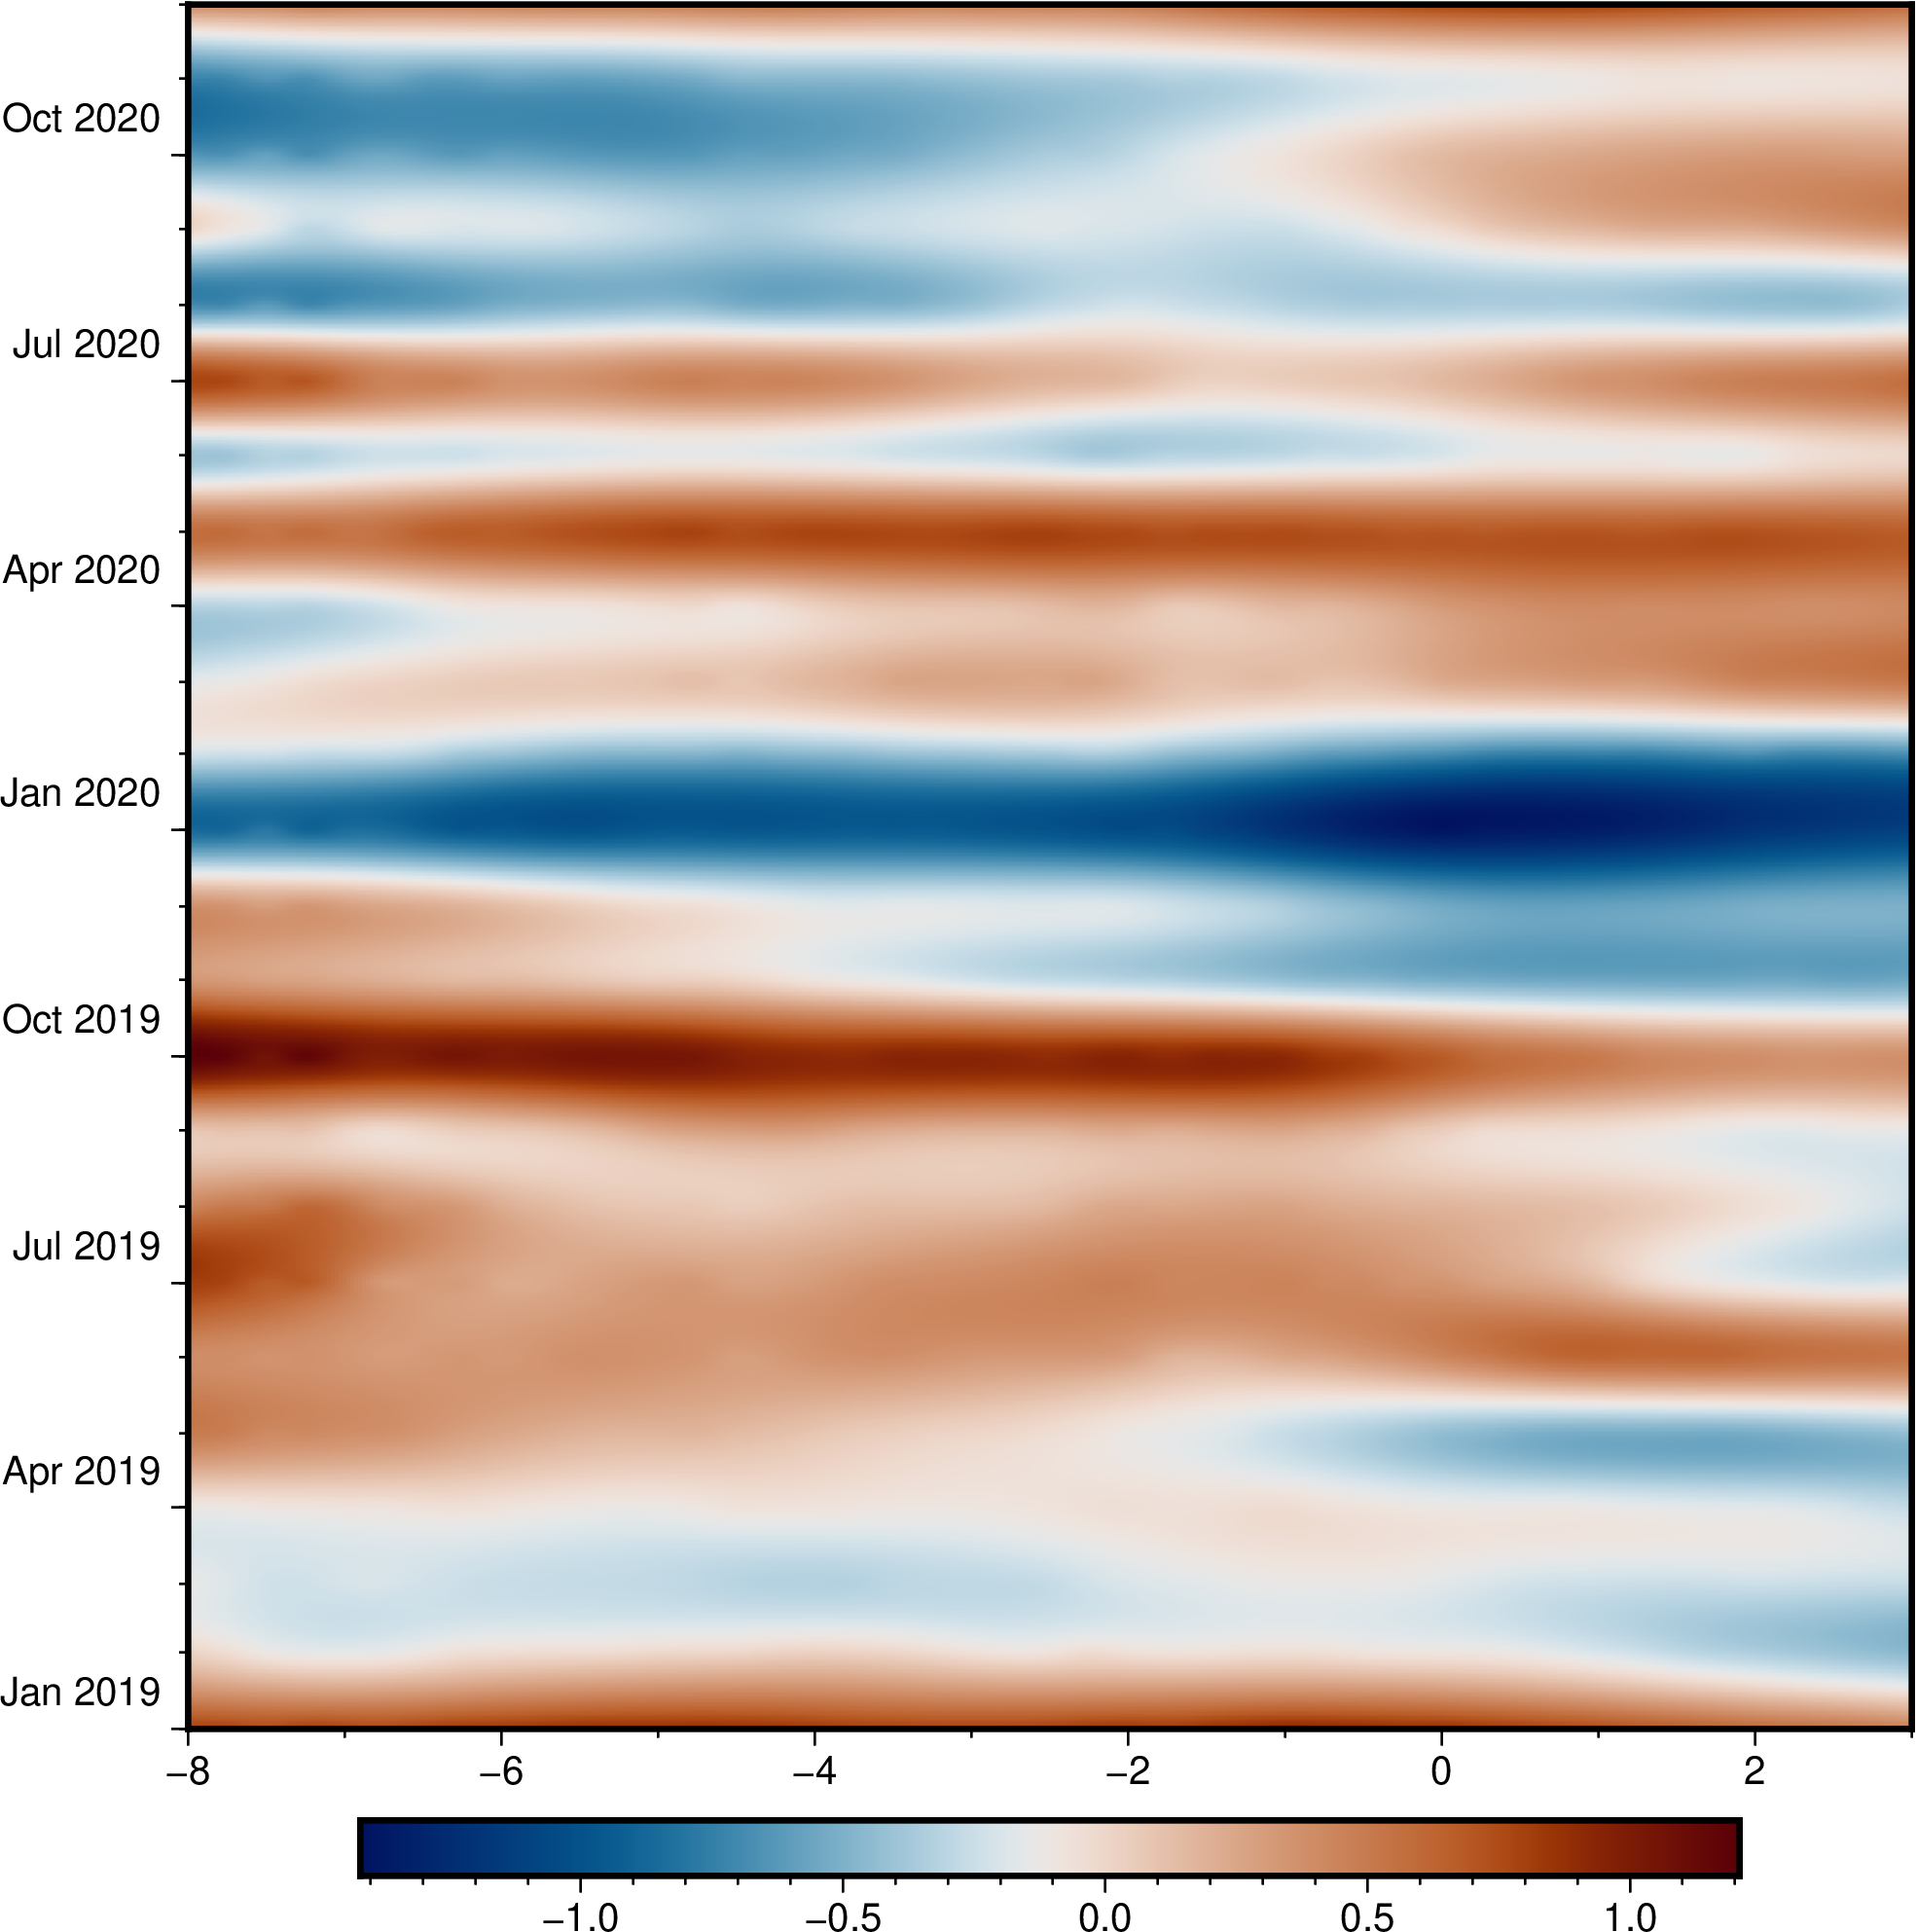
I’ve generated a Hovmuller diagram using MATLAB and saved the output. Now, I’m attempting to reproduce it in GMT 6.5, but I’m facing an issue with map resolution. The attached map appears blurry, and it seems to be related to resampling. I’ve already tried resampling, but the results are still not satisfactory.
I’ve also included my data and script, inspired by @PlanetGus for reference. I’m open to suggestions and approaches to improve the map resolution, whether it’s in GMT, Julia, or PyGMT. Any help or guidance would be greatly appreciated.
Many thanksLong_time.txt (1.8 KB)
My idea behind choice of values was a mix of trial and common sense. Your source special resolution is 0.25 degrees, temporal 1month. surface does interpolation, the result of interpolation can get wobbly, like on your plot, this is why the trial and error approach may be needed. Adding nodes without changing grid boundaries means using meaningful fractional number for the new special resolution, like 0.05 or 0.025 or 0.01 degrees, and the new temporal resolution, like 1 day (86400 seconds) or half a day (43200 seconds), not less than 1 hour anyway (3600 seconds).
gmt gmtinfo NGoG_U10_1.txt -I0.25/86400 could be gmt gmtinfo NGoG_U10_1.txt -Ie instead, I only needed to call gmtinfo to get your data boundaries for surface in a convenient way (-R...).
You could also convert your temporal values into “months since 2019-01-01”. This way your source data would effectively become a regularly gridded data. Then the data could be converted into a netCDF grid file using gmt xyz2grd and interpolated using gmt grdsample. Also when plotting you wouldn’t get the dates direct, but the fractional “months since 2019-01-01” value. These would need to be rescaled to get back the real dates on the data and axis. Could be fun, but I could not figure out how to scale “months since 2019-01-01” values back into timestamps for plotting in 5 minutes. Maybe it’s even a wrong idea to do it like this.