hi,
import pandas as pd
import pygmt
df = pd.read_csv("https://github.com/mwaskom/seaborn-data/raw/master/penguins.csv")
df.species = df.species.astype(dtype="category")
cb_annots = list(df.species.cat.categories)
region = pygmt.info(
    data=df[["bill_length_mm", "bill_depth_mm"]],
    per_column=True,
    spacing=(3, 2),)
fig = pygmt.Figure()
fig.basemap(
    region=region,
    projection="X10c/10c",
    frame=[
        "xafg+lBill length (mm)",
        "yafg+lBill depth (mm)",
        "WSen+tPenguin size at Palmer Station",],)
pygmt.makecpt(
    cmap="inferno",
    series=(df.species.cat.codes.min(), df.species.cat.codes.max(), 1),
    color_model="+c" + ",".join(cb_annots),)
fig.plot(
    x=df.bill_length_mm,
    y=df.bill_depth_mm,
    size=df.body_mass_g * 7.5e-5,
    fill=df.species.cat.codes.astype(int),
    cmap=True,
    no_clip=True,
    style="cc",
    transparency=0,)
fig.colorbar()
fig.show()
How can I provide diffrent styles for each scatter plot?
Thank you
Hello @Idontknow_007,
you can change the symbol used for plotting by adjusting the style parameter. For example, to get squares instead of circles (style="cc"), use
style="sc", # s for squares, c for centimeters
For an overview of the available symobls, please have a look at Basic geometric symbols — PyGMT.
Thank you @yvonnefroehlich .
I was looking to provide different styles for each group.
E.g., square, circle and traingle for three different groups…
Ah, OK - I am sorry, I missunderstood your questions.
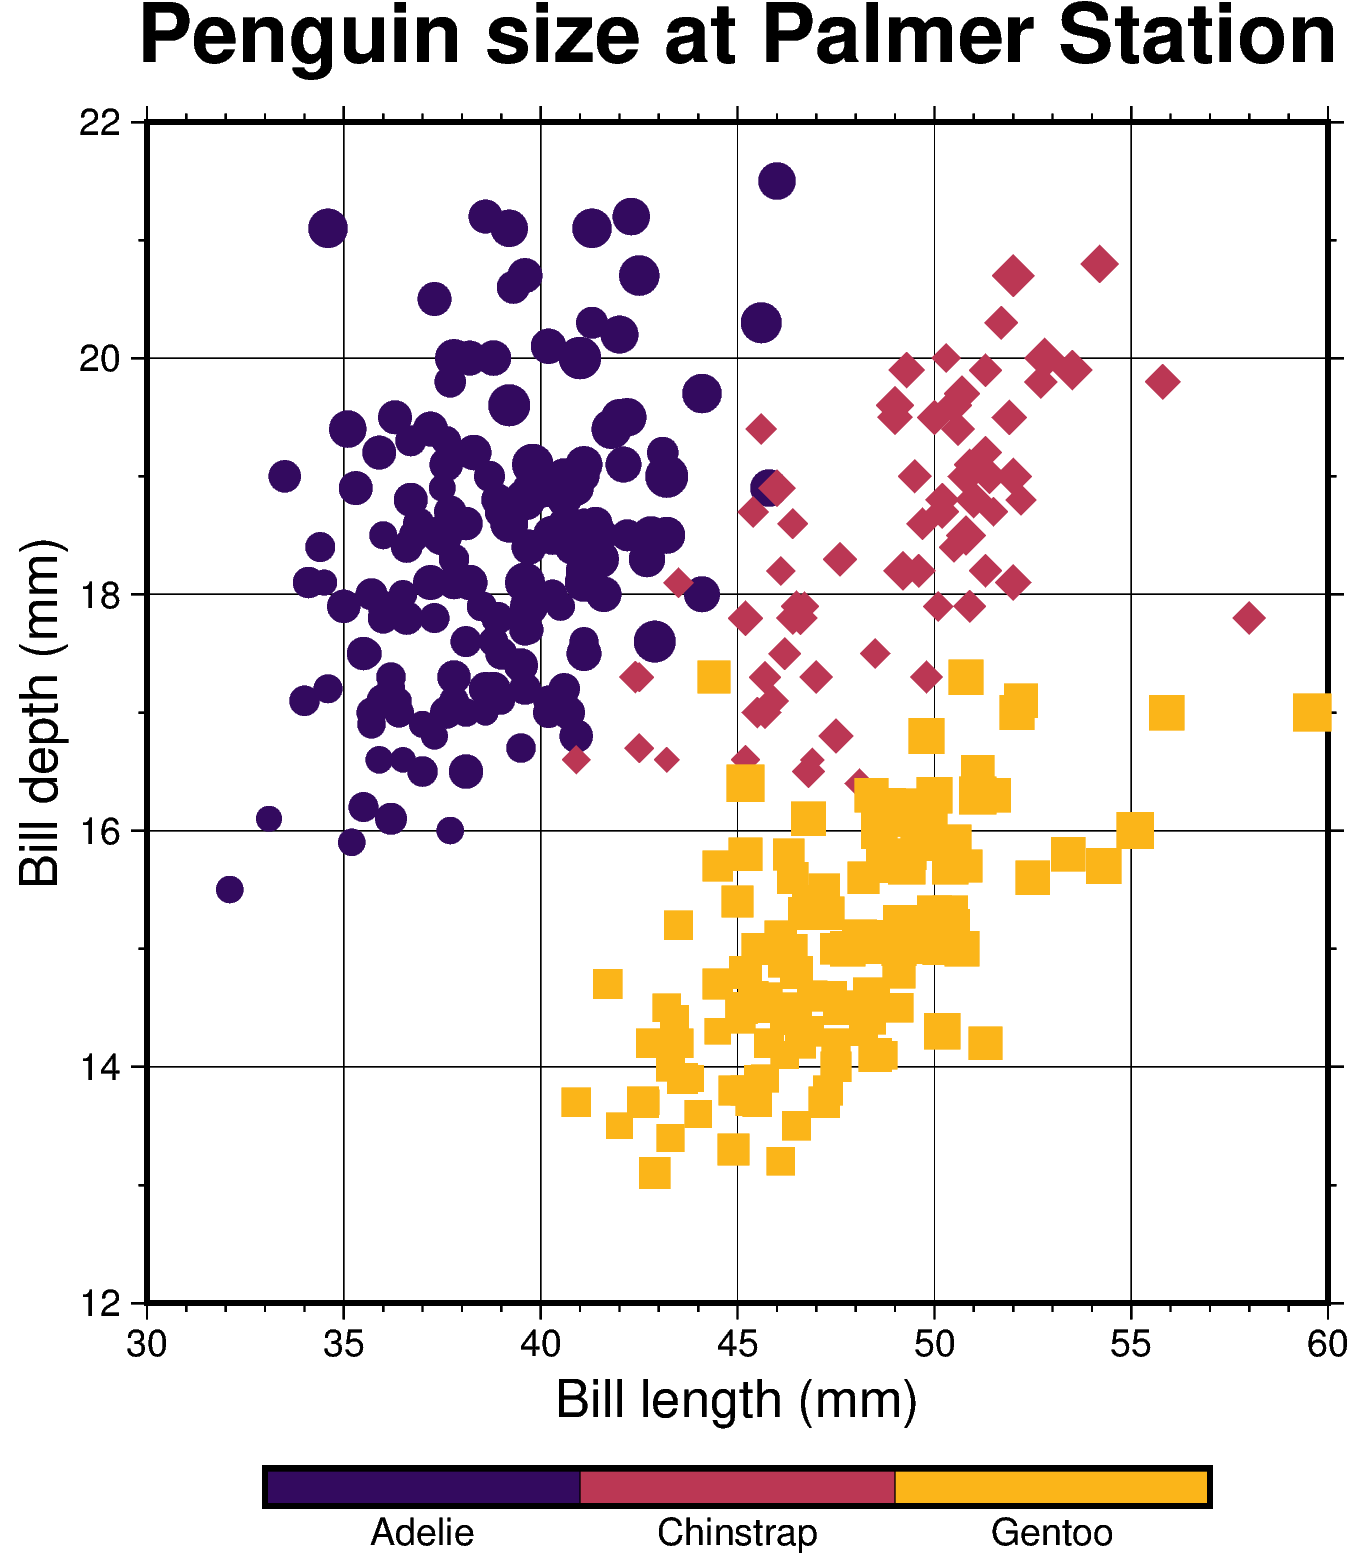
You can filter the pandas dataframe based on the different species and assign symbols for the different species, e. g.,:
# Set up dictionary for asign symbols to the different species
dict_style = {"Adelie": "c", "Chinstrap": "d", "Gentoo": "s"}

# Go through all species and plot them with the desired symbol
for group in ["Adelie", "Chinstrap", "Gentoo"]:
    fig.plot(
        x=df[df["species"]==group].bill_length_mm,
        y=df[df["species"]==group].bill_depth_mm,
        size=df[df["species"]==group].body_mass_g * 7.5e-5,
        fill=df[df["species"]==group].species.cat.codes.astype(int),
        cmap=True,
        no_clip=True,
        style=f"{dict_style[group]}c",
    )
1 Like
Great, thank you @yvonnefroehlich . Appreciate it.