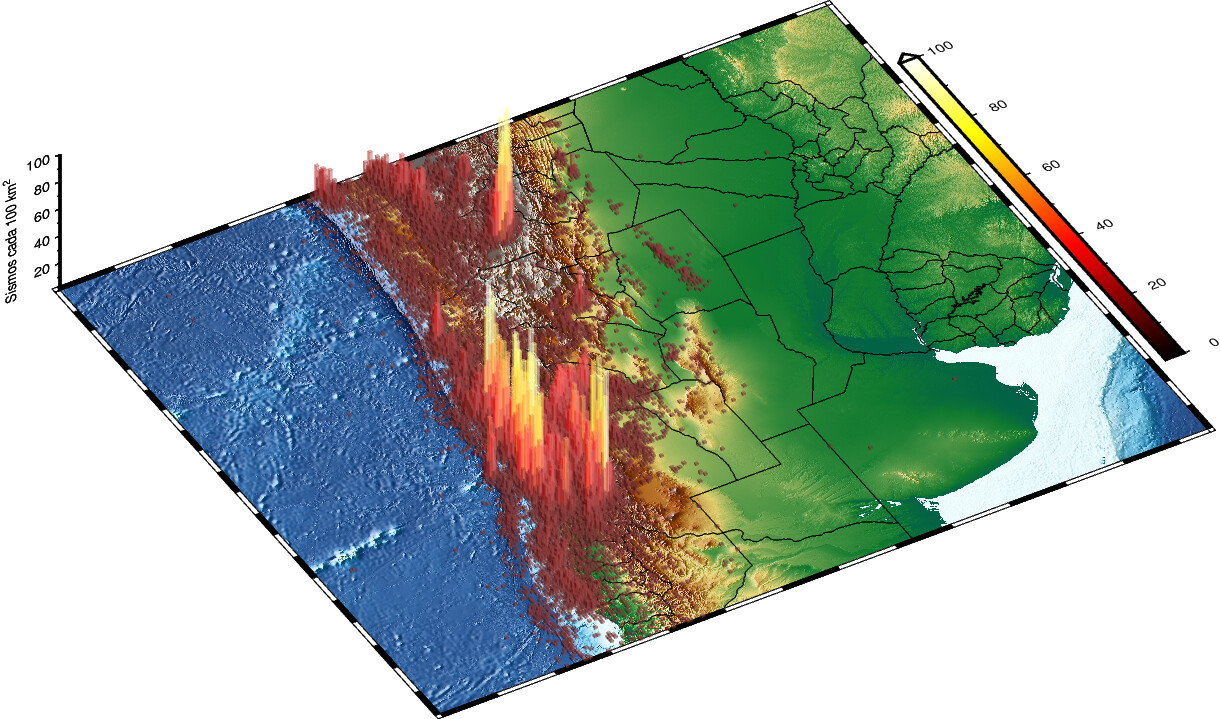
I made this figure where I plot columns representing the earthquakes by each 10 km2 (done with gmt blockmean -R$REGION -Sn -C -I10k).
In the map I use this to plot the columns (6 arc-min):
gmt plot3d -p $OUT -So0.1u -C -i0:2,2 -t50
How can I set the base of the columns to 10 km? I tried -So10k but I get:
Length <unit> k not supported - revert to default unit [cm]
You need to play with the +b|B modifiers
-Sb [size [c |i |p |q ]][+b |B [base ]][+v |i ny ][+s [gap ]]
I think that +b|B are for the z value of the column.
I want to define the x and y dimensions of the base of the 3d columns.
That is what you defined with the -I of blockmean
Exactly. I want to use that dimension for the columns so I can get a figure similar to the 3-D Histrogram of example 8 .
In that case works, because the grid was 5 arc-minut and them -So0.0833333u was set for the columns. But, in my case, the grid is in km.
I’m confused now, Since you added the bars on a geog grid the coordinates of those bars are in geogs too and the width = 0.1 which is ~10 km. Or the bars file (the one passed in to plotd3d) is not in geogs?
My data looks like this (long, lat, number of earthquakes). The log, lat are use to place the bars. I think I need two more columns to define the xsize and ysize (in c,i,p) that would represent 10 km in the map. I first use -I0.1u that is ca. 10 km.
-69
-33
3
-68.8888888889
-33
6
-68.7777777778
-33
3
-68.6666666667
-33
3
-68.5555555556
-33
1
-68.4444444444
-33
3
-68.3333333333
-33
2
-68.2222222222
-33
1
-68.1111111111
-33
1
-68
-33
2
And doesn’t -So0.1u give you what you want?
I can live with that. But it is not exactly what I want.
Don’t know if it helps,
I used that in one of my script:
-So$(gmt math -Q 10 KM2DEG -Vq =)
the verbose-quiet because gmt send some warnings about ellipsoids
1 Like
Joaquim
November 7, 2022, 7:26pm
11
That is also an approximation because it’s true only in N-S.