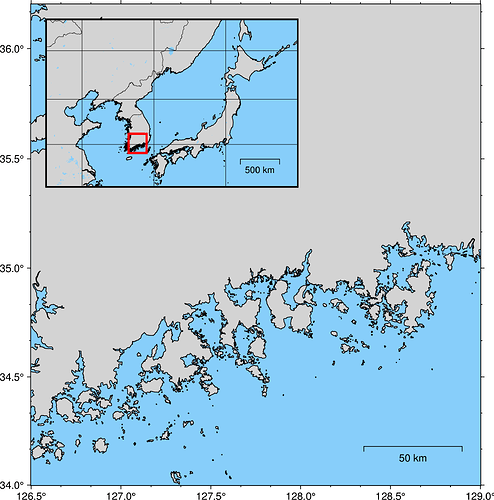
How to show latitude/longitude tick marks for the PyGMT inset figure

I am making the inset figure that shows wide region that contains main figure.

Following basic tutorial that is provided for making inset, I could successfully create one, but I am having trouble showing latitude/longitude grids for the inset figure. I could not find any example related to it, so I am asking here.

My PyGMT version is the latest stable version (v0.6.1).

I attach the code below:

fig=pmt.Figure()

pmt.config(MAP_FRAME_TYPE="plain") # No fancy boundary
pmt.config(FORMAT_GEO_MAP="ddd.x") # Display latitude/longitude upto 1st decimal point

# Set the region to show (latitude/longitude min/max range)
subset_region=[126.5, 129.0, 34.0, 36.2]

fig.basemap(region=subset_region, projection="M15c", frame=["WSne", "xaf", "yaf"])
fig.coast(land="lightgrey", water="lightskyblue", shorelines="1/0.5p", map_scale="n0.85/0.075+l+c127.7/34.95+w50")

with fig.inset(position="jTL+w8.4c/5.6c+o0.5c", box="+p1.5p"):
    
    # Set the region to show (latitude/longitude min/max range)
    inset_region=[115.0, 150.0, 30.0, 48.0]
    fig.basemap(region=inset_region, projection="M15c", frame=["WSne", "xaf", "yaf"])
    fig.coast(land="lightgrey", water="lightskyblue", borders=["1/0.2p,black"], shorelines="1/0.5p", map_scale="n0.85/0.15+l+c127.7/34.95+w500")

    ###### Box encompassing the large area ######
    rectangle = [[subset_region[0], subset_region[2], subset_region[1], subset_region[3]]]
    fig.plot(data=rectangle, style="r+s", pen="2p,red")  

# fig.savefig(fname="Station_map_tectonic_inset.pdf", dpi=500)
fig.show(width=1000)

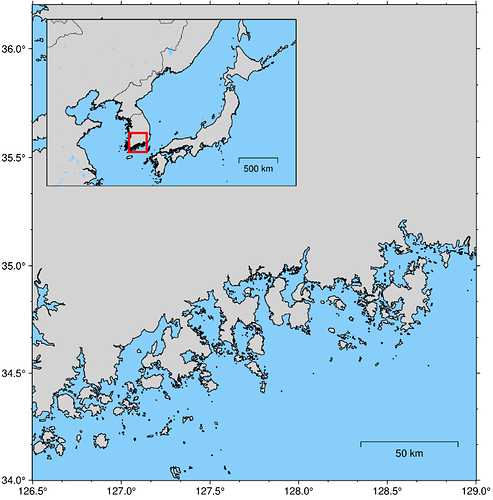
The figure that is currently reproduced is the following:
Is this what you want?

Your script doesn’t work because the layer produced by the coast command covers the layer produced by the basemap comand. So instead of using coast after basemap, you can use a single coast command to draw coastlines and grids at the same time. Try changing your command to this one:

fig.coast(
    region=inset_region, 
    projection="M?", 
    frame=["WSne", "xafg", "yafg"], 
    land="lightgrey", 
    water="lightskyblue", 
    borders=["1/0.2p,black"], 
    shorelines="1/0.5p", 
    map_scale="n0.85/0.15+l+c127.7/34.95+w500"
)
1 Like

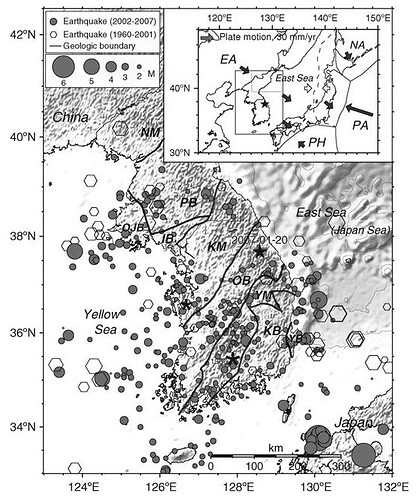
Thanks for your reply. I think I was not very clear about what I want. I want latitudes and longitudes to show up at the inset boundaries, similar to large figure.
I wonder if this option is implemented by PyGMT.

I attach the example of figure with inset below.

Now I see what you want.

You need to give extra spacing inside the inset box using the margin parameter:

with fig.inset(position="jTL+w8.4c/5.6c+o0.5c", box="+p1.5p+gwhite", margin="0.8c"):

Besides that, you also need to change your projection="M15c" to projection="M?" instead, because the inset dimensions are automatically determined by +w8.4c/5.6c in the position paramter.

I got it! Your solution is very clear.

Thanks a lot!

with fig.inset(position=“jTR+w3.5c/4c+o0.1c”, margin=0.1, box=“+p1.5p,BLACK”):
# Set the region to show (latitude/longitude min/max range)
inset_region=[69, 98, 6, 37]
fig.basemap(region=inset_region, projection=“M?”, frame=[“WSne”, “xaf”, “yaf”,“a15f10”])
fig.coast(land=“lightgrey”, water=“lightskyblue”,shorelines=“0.1p”, borders=[“1/0.2p,black”],frame=[“WSne”, “xaf”, “yaf”])

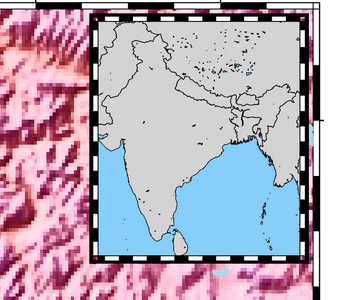
image

my inset is not showing lat long… can you help

Dear Sangeetha, you should try what seisman told:
Your script doesn’t work because the layer produced by the coast command covers the layer produced by the basemap comand. So instead of using coast after basemap , you can use a single coast command to draw coastlines and grids at the same time.

Try using only coastline command and skip basemap. It always work for me. Basemap and coasline together mesh up the things which I realised.