with fig.inset(position=“jTR+w3.5c/4c+o0.1c”, margin=0.1, box=“+p1.5p,BLACK”):
# Set the region to show (latitude/longitude min/max range)
inset_region=[69, 98, 6, 37]
fig.basemap(region=inset_region, projection=“M?”, frame=[“WSne”, “xaf”, “yaf”,“a15f10”])
fig.coast(land=“lightgrey”, water=“lightskyblue”,shorelines=“0.1p”, borders=[“1/0.2p,black”],frame=[“WSne”, “xaf”, “yaf”])
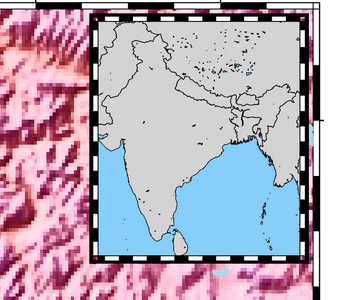
my inset is not showing lat long… can you help