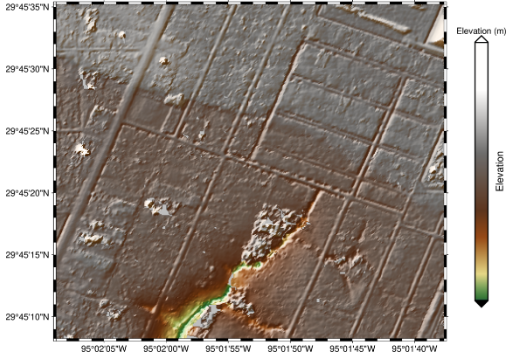
I am completely new to the pygmt. I have a DEM Geotiff file and i used following code to plot the elevation map with colorbar. But colorbar is not showing the label so i don’t have idea what is the minimum or maximum value of elevation. what should i do to fix this? Also how do i change the frame from degree, minutes second format to decimal format?
My code is
`import pygmt

fig = pygmt.Figure()
fig.grdimage(grid=dem_2001, cmap="geo", shading=True, frame=True)
fig.colorbar(frame=["a1000", "x+lElevation", "y+lElevation (m)"], position="JMR+o1.2c/0c+w10c/0.5c+e")
fig.show()`
and the output image is

Hello @blueyeti1881,
Welcome to the GMT forum  and great that you started using PyGMT
  .
.
colorbar annotations
The step of your colorbar annotations (a) is currently set to 1000. You probably have to reduce it corresponding to the values range of your elevation data, maybe frame=["a100",...] or frame=["a10",...] gives you the desired result.
map frame annotations
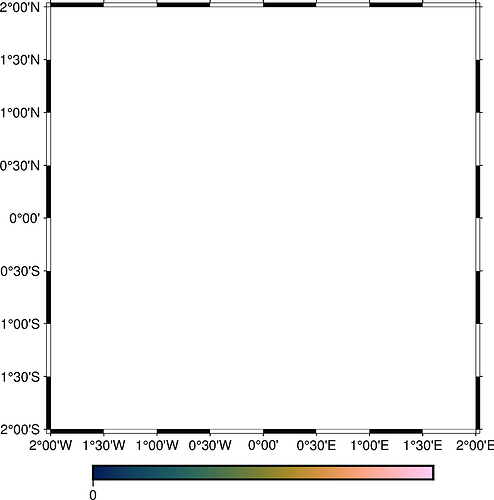
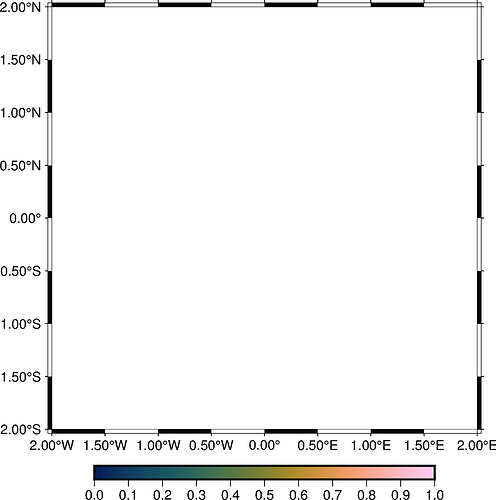
To change the map frame annotations from degrees to decimal format, you need to adjust the GMT default parameter FORMAT_GEO_MAP via pygmt.config(PARAMETER=value).
Below, you find a general code example:
import pygmt

size = 2

# (I)
fig = pygmt.Figure()
fig.basemap(region=[-size, size, -size, size], projection="M10c", frame="a0.5")
fig.colorbar(cmap="batlow", frame="xa10")
fig.show()

# (II)
fig = pygmt.Figure()
pygmt.config(FORMAT_GEO_MAP="ddd.xxF")  # decimal map frame annotations
fig.basemap(region=[-size, size, -size, size], projection="M10c", frame="a0.5")
fig.colorbar(cmap="batlow", frame="xa0.1")    # smaler step for colorbar frame annotations
fig.show()
(I)
(II)


