This is the script testtest.txt (1.7 KB)
This is the data usgs_cat2005test.txt (3.3 KB)
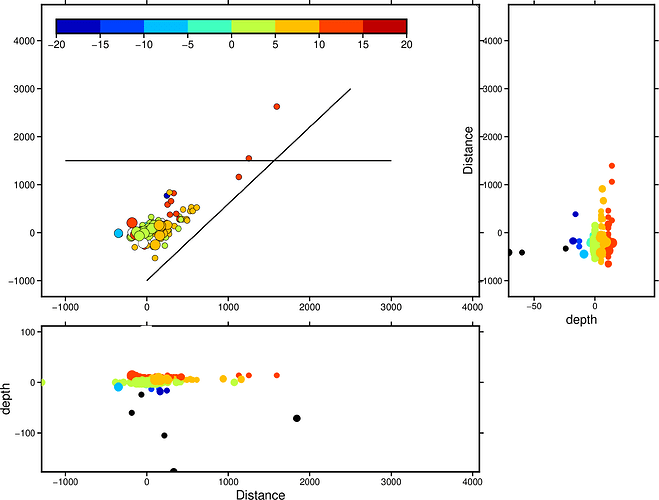
This is the result:
The puzzle is that the events projection of the slash cross line does not look correct.
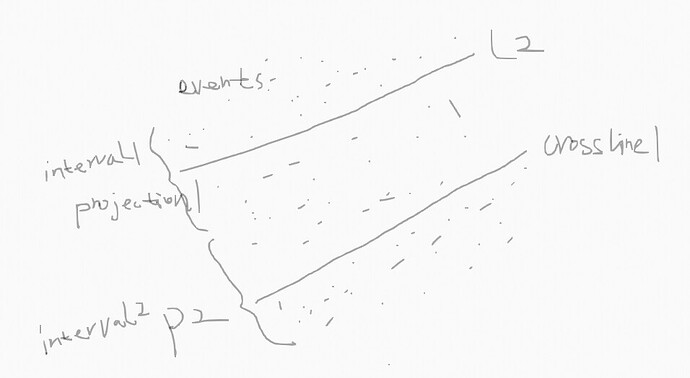
i want to get the data projection between the cross lines’ intervals.
how to do that?Thank you very much.
I think what you’re asking for is work in progress (development).
Check this Grdtrack vertical profile along track
It looks different. What I want is the projection of microseismic event points within a certain range from the cross line.
I dont understand your drawing. It shows two ~parallel lines while your plot has lines that intersect. Which one is the “slash cross line”?
I mean the seismic events projection of this cross line may not be correct.It seems that it doesn’t match.
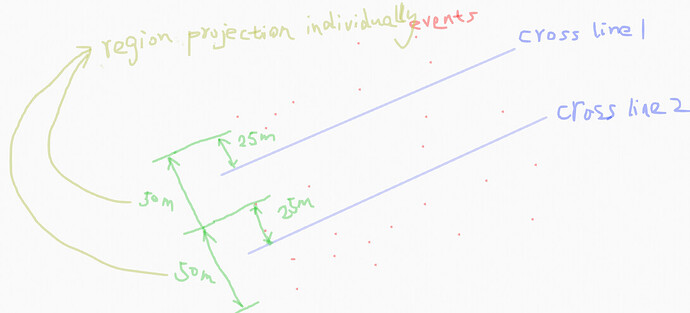
And what I really want is the projection of microseismic events at a certain distance from both sides or unilateral side of the cross line.Therefore, it can be projected in different continuous areas with the ~parallel cross lines.
OK, I will look at the first case to make sure it works or not.
I am still not sure what your other sentences are trying to say - sorry - but we can get to that later.
1 Like
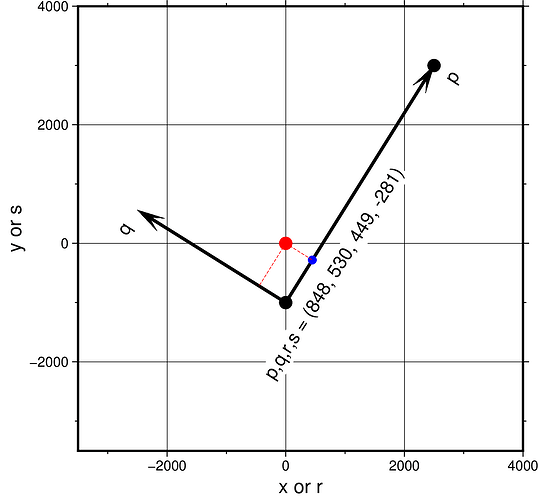
The output of project -N looks correct to me. I wonder if perhaps you are not using the right coordinates in your projected plots. Given you are using gawk '{if($4<100) print $3,$5,$3}' cross2.dat the coordinates you are using in that plot on the right are the original z-value from USGS column 3 (your “depth”) versus column 5 in cross3.dat, which is the coordinate s from project. The s coordinate is the x-coordinate in the original coordinate system of the projected point after it is moved onto the line q = 0 (the blue circle below). See the figure below. Here the red circle is the original (x,y) coordinates and the blue circle is the projected point whose coordinates are (r,s). The (x,y) point’s projected coordinate (red) is (p,q). So you are plotting the s coordinates of the blue points. Is this what you want? I suspect you meant q. Input (x,y) becomes (p,q) in the projection, while (r,s) is the inverse projection of (p,0).
2 Likes
