Hi @skgiter, welcome to the forum! I will have to say that x2sys is not an easy module to use, but will try to help out as much as I can. It will likely involve looking up the GMT documentation at https://docs.generic-mapping-tools.org/6.2/supplements/x2sys/x2sys_init.html and https://docs.generic-mapping-tools.org/6.2/supplements/x2sys/x2sys_cross.html
To get you started, this is what I do for my work on ICESat-2 with x, y, h (height/elevation) and t (time) columns. The code is adapted from https://github.com/weiji14/deepicedrain/blob/v0.3.0/atlxi_lake.ipynb (scroll down to the ’ Crossover Track Analysis’ section).
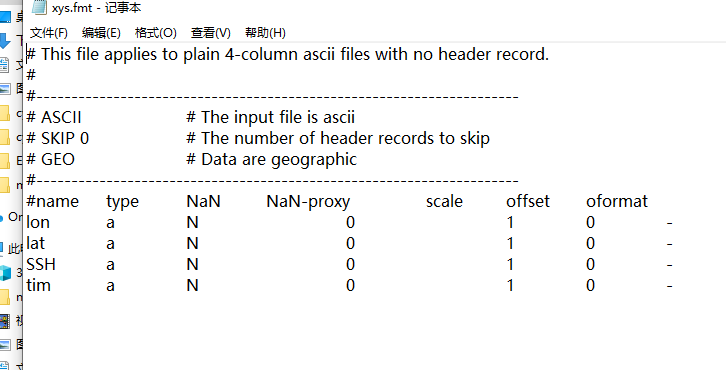
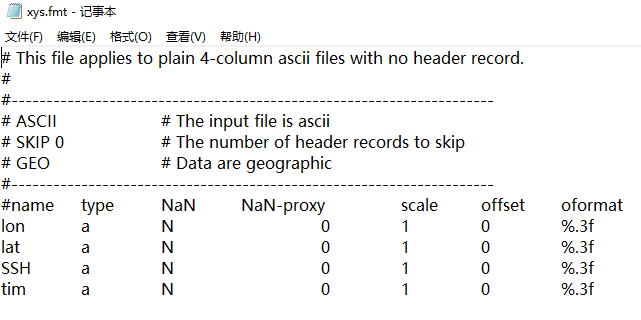
- You will need to have a Format Definition File (*.fmt) in place first. Mine is at https://github.com/weiji14/deepicedrain/blob/v0.3.0/X2SYS/ICESAT2/xyht.fmt and looks like the below (!!important: put this file in X2SYS/TAGNAME where TAGNAME is the tag name you use, e.g. ICESAT2 in my case):
#
# Define file for X2SYS processing of ASCII tsv files
#
# This file applies to plain 4-column ASCII files.
#
#---------------------------------------------------------------------
#ASCII		# The input file is ASCII
#SKIP 1		# The number of header records to skip
#---------------------------------------------------------------------
#name	intype	NaN-proxy?	NaN-proxy	scale	offset	oformat
x	a	N		0		1	0	%g
y	a	N		0		1	0	%g
h	a	N		0		1	0	%g
t	a	N		0		1	0	%g
- Next, you will need to initialize an X2SYS database using
x2sys_init
import os
import pygmt

x2syspath: str = "X2SYS"
os.environ["X2SYS_HOME"] = os.path.abspath(x2syspath)

# Initialize X2SYS database in the X2SYS/ICESAT2 folder
pygmt.x2sys_init(
    tag="ICESAT2",  # satellite name
    fmtfile=f"{x2syspath}/ICESAT2/xyht",  # format definition file
    suffix="tsv",  # data are in tab separated format
    units=["de", "se"],  # distance in metres, speed in metres per second
    gap="d250e",  # distance gap up to 250 metres allowed
)
- Now comes the hard part, doing the actual crossover calculation using
pygmt.x2sys_cross. I store my track data in pandas.DataFrame which keeps things simpler.
track1: pd.DataFrame = pd.read_csv(...)  # 1st file with x, y, h, t columns
track2: pd.DataFrame = pd.read_csv(...)  # 2nd file with x, y, h, t columns

df_crossover: pd.DataFrame = pygmt.x2sys_cross(
    tracks=[track1, track2],
    tag="ICESAT2",
    # region=[-460000, -400000, -560000, -500000],  # set a bounding box region here
    interpolation="l",  # linear interpolation
    coe="e",  # external crossovers
    trackvalues=False,  # Get crossover error (h_X) and mean height value (h_M)
    # trackvalues=True,  # Get track 1 height (h_1) and track 2 height (h_2)
    # outfile="xover_236_562.tsv"  # optionally, output to a file instead of a dataframe
)
and below this is what the crossover output would look like. The key things are:
- the crossover locations (x and y)
- the time when the two tracks crossed the crossover point (t_1 and t_2)
- the crossover anomaly (h_X) which is the difference between h_1 and h_2
- the mean (average) height value which is (h_1 + h_2) / 2
               x             y                 t_1                 t_2  \
0 -216453.946304 -611770.40777 2019-09-07 11:53:02 2019-09-11 21:07:28
1 -216453.946304 -611770.40777 2019-09-07 11:53:02 2019-12-11 16:47:17
2 -216453.946304 -611770.40777 2019-09-07 11:53:02 2020-06-10 08:06:50
3 -216453.946304 -611770.40777 2019-09-07 11:53:02 2020-09-09 03:46:38
4 -216453.946304 -611770.40777 2020-03-07 03:12:36 2019-09-11 21:07:28

         dist_1        dist_2      head_1      head_2        vel_1  \
0   3296.598252    703.294816  359.881315  219.076615  6878.997551
1   3296.598252   7107.346604  359.881315  219.076615  6878.997551
2   3296.598252  13511.398391  359.881315  219.076615  6878.997551
3   3296.598252  19915.450178  359.881315  219.076615  6878.997551
4  10981.312349    703.294816  359.881315  219.076615  6906.821748

         vel_2       h_X        h_M
0  6879.319824  0.004869  62.719589
1  8267.201695  0.006300  62.718874
2  6879.319824 -0.056660  62.750354
3  6910.273551 -0.754562  63.099305
4  6879.319824 -0.063100  62.685604
If you set the parameter trackvalues=True, then you will get the raw height values (h_1 and h_2).
Hopefully this will get you started. I’ve simplified things a lot, but there are some quirks with using X2SYS (e.g. data have to be in specific folder, the environment variable is confusing, etc) so let us know if you need more help (please post your error messages).
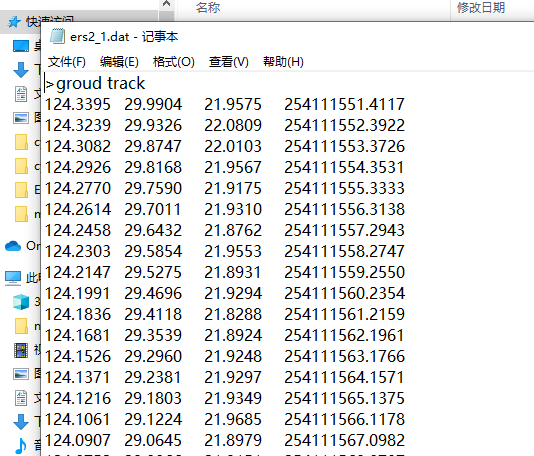
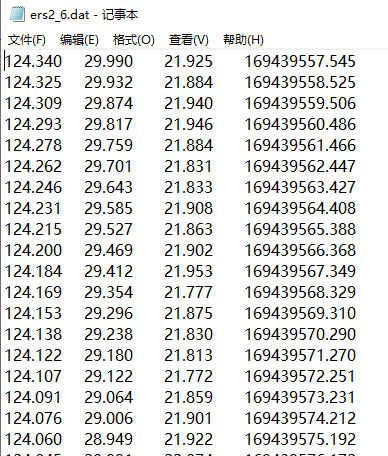
If you provide an example or sample of the data you would like to do crossover analysis on, that would also be of help, and we can give you better advice on what to do 
P.S. Remember to cite the x2sys paper at https://doi.org/10.1016/j.cageo.2009.05.009 if you use it in your work!