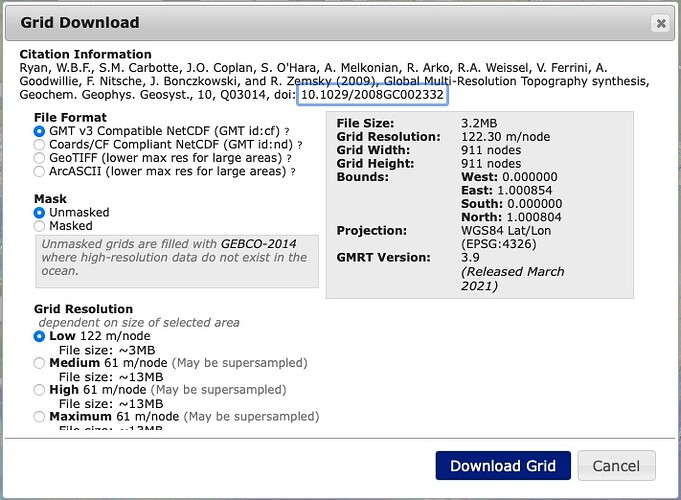
Does anyone know how to import a grid file downloaded from GMRT (GMRT.org) into pyGMT? I have two .asc datafiles (which contain topgraphic and bathymetric information) I downloaded from the website, but I do not know which function I should use to import them into pyGMT. Would I use xarray?
Would it not be simpler to get netCDF/GMT grids from GMRT to begin with?
I think that would be simpler. I do have the grid files. However, now I am running into an issue with uploading the grd file. I have the datafile on my computer and I need to link to it. Right now I am doing it like this:
topo_data = open(’/Users/madeleinelucas/Desktop/MGL2104_Bathymetry_50m.grd’)
fig = pygmt.Figure()
fig.grdimage(grid=topo_data)
and I’ve also tried this:
fig = pygmt.Figure()
fig.grdimage(grid="/Users/madeleinelucas/Desktop/MGL2104_Bathymetry_50m.grd")
However, both ways just read the file in as a string instead of a grid file. I’ve looked at the documentation but I can’t find a clear explanation of how to import an external topography file that is not just from the buiilt-in “earth relief” datasets. I’m sorry that this may seem like a really simple question, I just started using pyGMT yesterday.
Thank you!
Hi @madeleinelucas, welcome to the forum! The fig.grdimage(grid="/Users/madeleinelucas/Desktop/MGL2104_Bathymetry_50m.grd") method should work. Could you copy and paste the error message you’re getting? You can zip up the grd file and upload it (if it’s not too big), or just provide a direct link to the file.
Hi @weiji14! Here is a picture of the error: Screen Shot 2021-11-09 at 11.57.59 AM|690x393 It’s just a black square… Here a link to the file: Cascadia_ModernMBES_50m_2.grd.zip - Google Drive
Do you think there could be an issue with the grd file?
Thanks for the help!!
Do you think the problem could be that the file type is not compatible with pyGMT?
So this is the output from print(pygmt.grdinfo("Cascadia_ModernMBES_50m_2.grd")):
Cascadia_ModernMBES_50m_2.grd: Title: DMagic Data Export
Cascadia_ModernMBES_50m_2.grd: Command: Created by DMagic
Cascadia_ModernMBES_50m_2.grd: Remark:
Cascadia_ModernMBES_50m_2.grd: Gridline node registration used [Cartesian grid]
Cascadia_ModernMBES_50m_2.grd: Grid file format: cf = GMT netCDF format (32-bit float, deprecated)
Cascadia_ModernMBES_50m_2.grd: x_min: 21775 x_max: 450525 x_inc: 50 name: user_x_unit n_columns: 8576
Cascadia_ModernMBES_50m_2.grd: y_min: 4521675 y_max: 5543225 y_inc: 50 name: user_y_unit n_rows: 20432
Cascadia_ModernMBES_50m_2.grd: v_min: -11631.56 v_max: -4.58 name: user_z_unit
Cascadia_ModernMBES_50m_2.grd: scale_factor: 1 add_offset: 0
Cascadia_ModernMBES_50m_2.grd: format: classic
It seems like the value stretches from -111631.56 to -4.58. It could be that most of your values lie on the bottom range? I tried to plot a subset of the grid and added a colorbar like so:
fig = pygmt.Figure()
fig.grdimage(
    grid="Cascadia_ModernMBES_50m_2.grd",
    region=[21775, 22775, 4521675, 4522675],
    nan_transparent=True
)
fig.colorbar(position="JMR+o1c/0c+w7c/0.5c+n+mc")
fig.show()
produces:
but it seems to think all values are NaN for some reason, which is why everything is black. Might need to use grdhisteq or something to stretch the values into a range that can be plotted properly.
It’s incredible that along decades they manage to create twisted netcdf grids. For a long time it was GMT3 netCDF grids.
But not saying this is the cause. GMT tries to be resilient to this.
These must be old files. Lamont fixed the old GMT 3 stuff perhaps a decade ago unless they have had a major regression. I will have a look at the MGRT site…
So what happened is that the default output grid format is still GMT3 (!) and @madeleinelucas assumed that was fine. I will bug them about this. Meanwhile, @madeleinelucas needs to go back and get the COARDS netcdf files.
And we don’t read GMT3 nc grids (actually, vectors) anymore? (No big loss to Humanity if we don’t)
We should still do - nobody has touched that code in a very long time. That grid is in UTM meters (?) so not sure what part of the world it is from.
Andrew Goodwillie just told me they will remove the GMT3 option.
Good. There aren’t many people who knows what GMT3 nc grids are.
I think my problem was that the file I was using isn’t from GMRT. It was a bathymetry compilation specially formatted to work with an older version of GMT (I’m assuming GMT3). I asked my collaborator who gave me the file for the modern version. Also, I was able to download a file from GMRT website and it works just fine in pyGMT. However it’s weird that they still offer the GMT3 file on the GMRT website. Maybe it’s because a lot of people still use that version?m
Thank you all for your help! I’m really enjoying using pyGMT!
Hi - I need to open this question up again. The file that I was working with is not downloaded from GMRT, it is a compilation given to me. Does anyone think it is possible to convert it into something that will work with pyGMT and know how I would do that? Would I use grdconvert function? Thanks again.

