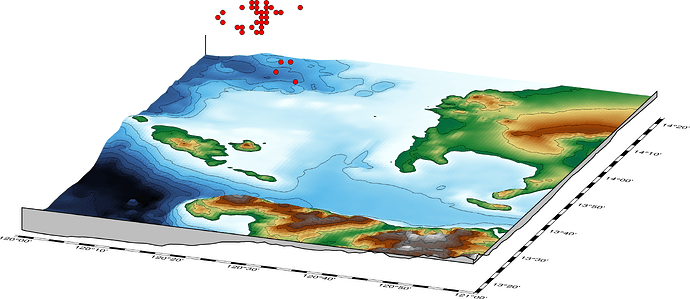
How do I include the depths of the plotted quakes on the map? And is it possible to view it in a cross-section? I’ve changed the values of my depths into negative but its still the same.
df = pd.read_csv(‘Eq.txt’)
grid = pygmt.datasets.load_earth_relief(resolution=“30s”, region=[120.000,121.000,13.275,14.364,-200,0])
fig = pygmt.Figure()
fig.grdview(
grid=grid,
perspective=[-200,20],
frame=[“xaf”, “yaf”, “SE”],
projection=“M20c”,
zsize=“1.5c”,
surftype=“s”,
cmap=“geo”,
plane=“1000+ggrey”,
contourpen=“0.1p”,
)
fig.plot3d(
x =df.lon,
y =df.lat,
z =df.dep,
style =‘c0.2c’,
color=‘red’,
pen = ‘black’,
)
fig.savefig(“3d.png”)
