Dear (py)GMT dev team and friends,
Let me present you an interactive solution developed during this summer by an MSc student, available on her github page: https://github.com/chelle0425/IntPyGMT
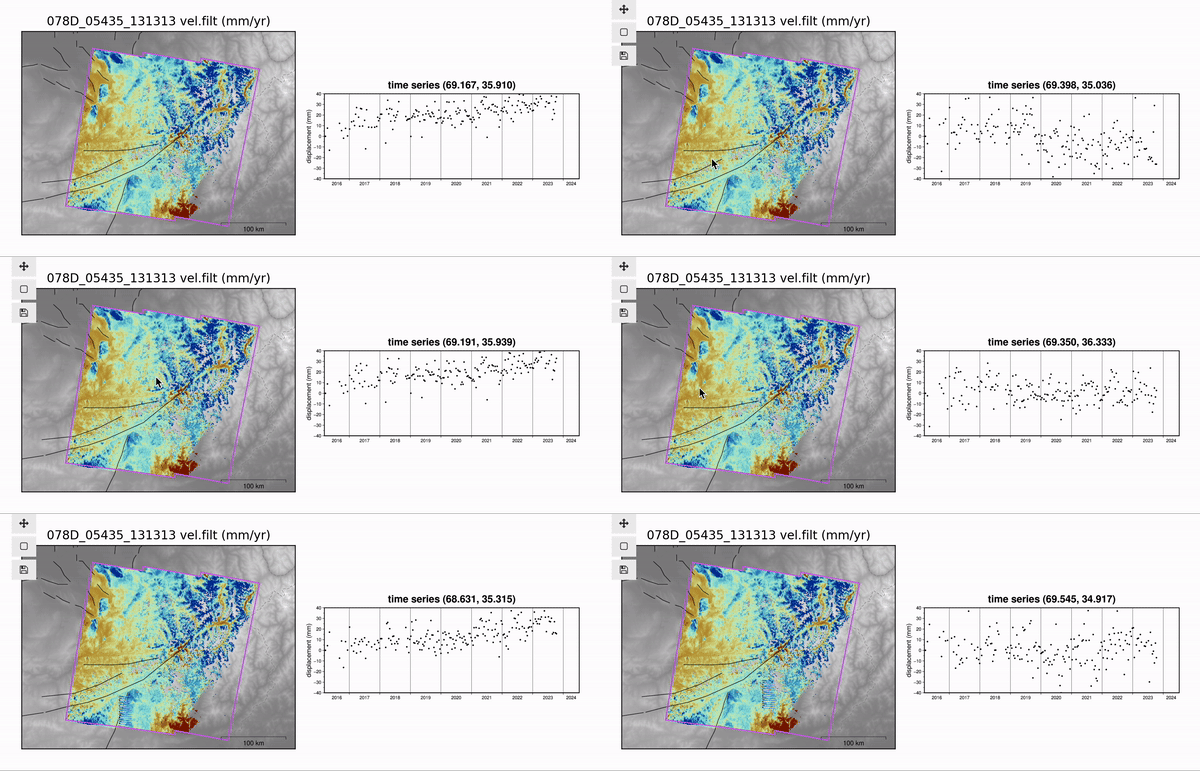
It allows users making their pygmt (or gmt) figure interactive in jupyter environment by getting an accurate coordinate on mouse click - see demo below where this is linked to a time series viewer function.
Note any GMT projection can be used here since the tool calls the mapproject (via clib API - see solution).

I hope you will like this and curious about your use case feedback :3