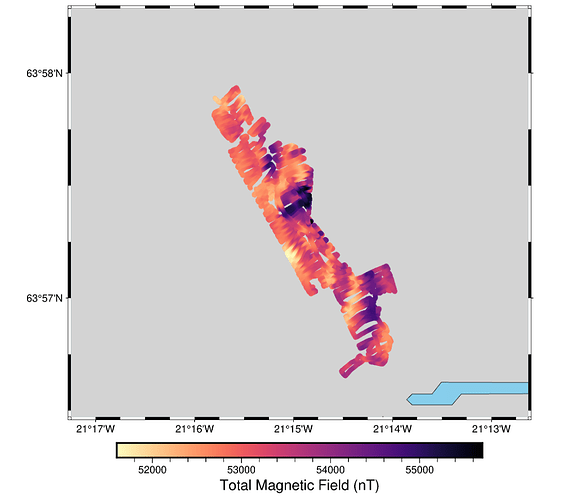
Hello, I am a beginner using pygmt and I ran into a problem.
I am trying to interpolate some magnetic data that I have but so far I am having no luck finding out a way to make it work.
My data is a set of irregularly spaced points with dimensions of x=Longitude, y=Latitude and total y=magnetic field.
My Idea was to use the pygmt.xyz2grd function or some other interpolation method.
this is the code that I got so far:
fig = pygmt.Figure()
region=[-21.287473, -21.210487,63.941199,63.971433]
grid = pygmt.datasets.load_earth_relief() #resolution="05m",region=region


fig.basemap(region=region, projection="M15c", frame=True)
fig.coast(land="lightgray", water="skyblue",shorelines=True)
magnetic_data = np.loadtxt('Official_all_data_snyrt.txt',skiprows=1)
pygmt.makecpt(cmap="magma", series=[magnetic_data[:,3].min(), magnetic_data[:,3].max()],reverse=True)

fig.plot(
    x=magnetic_data[:,1],
    y=magnetic_data[:,0],
    style="c0.15c",
    fill=magnetic_data[:,3],
    cmap=True,
)

fig.colorbar(frame="af+lTotal Magnetic Field (nT)")
fig.show()
Does someone have a good idea of how I can to the interpolation?
